• Products
  • Insights
  • Practice Management
  • Resources
  • About Us

What's Driving Markets...
1. Minutes from the January Federal Open Market Committee (FOMC) meeting revealed uneasiness about cutting policy rates too aggressively given prevailing upside inflation risks. The Federal Reserve (Fed) explicitly stated its belief that policy rates have peaked and was somewhat dismissive about the recent easing of financial conditions, noting that they remain in restrictive territory. The Fed also expressed concern about the reduced take-up of the overnight reverse repo (ON RRP) facility1 and indicated it could prompt an earlier end to its balance-sheet runoff2 (FIGURE 1). Why the concern? Because there’s a healthy debate about what’s the “right amount” of reserves in the system. The usage of the RRP tends to be indicative of the “extra” reserves that the Fed typically needs to drain out of the system to ensure short-term rates don't decline below its policy target. As the usage of the facility declines, the Fed (rightly) grows a bit more cautious as the cushion declines.


FIGURE 1

Changes in Reserve Levels May Prompt a Balance-Sheet Policy Shift
Declining Usage of the Fed's Overnight Reverse Repo Facility ($, billions)

As of 2/27/24. Data Sources: Federal Reserve Bank of St. Louis, Wellington Management, Hartford Funds.


2. Stubbornly high shelter prices appear to be hindering progress on core inflation, ostensibly delaying the onset of the Fed’s easing cycle. However, other measures of rental inflation, including new and existing leases, show more subdued price appreciation. We expect owners' equivalent rent3 (FIGURE 2) to decline further as housing comes more into balance and the lagged impact of higher mortgage rates takes hold. This would be consistent with other components of inflation, which are moderating due to a combination of demand (slowing, but still strong overall) and supply (less constrained for goods, still constrained for services, notably with the level of wages). Moreover, it’s important to note that the shelter/rental components of the Consumer Price Index (CPI) and Personal Consumption Expenditures Index (PCE)4 tend to have significant lags vs. market prices (FIGURE 3).


FIGURE 2 and 3

Sticky Shelter Prices Keep Core Inflation Elevated but Real-Time Data Lags
Left: CPI Inflation vs. Owners' Equivalent Rent; Right: Fed and Zillow Rent Indices (%, Year-Over-Year)

As of 1/31/24. Data Sources: Bloomberg, Zillow, Federal Reserve Bank of Cleveland, Wellington Management, Hartford Funds.


All the evidence suggests that the Bank of Japan is likely to end negative interest rates.


3. The Bank of Japan (BOJ) appears on the verge of ending its 8+ year negative interest-rate policy. Inflation slowed for a fifth consecutive month (FIGURE 4) but remains well above target with year-over-year core CPI ending January at 3.5%. The BOJ has been maintaining its ultra-loose policy to establish credibility in generating inflation after the country had experienced prolonged periods of low inflation/deflation over the last three decades. The pull-down in inflation is coming from lower goods inflation, which points to margin expansion and some pricing power. And higher expected wages coming out of the annual labor-union negotiations could keep domestic inflation above 2%. All the evidence suggests that the BOJ is likely to end negative interest rates.


FIGURE 4

Core CPI Slows but Still Ends January Above BOJ Target (2008-2024)
Japanese Core CPI and Bank of Japan Target Rate (%)

As of 2/29/24. Data Sources: Bloomberg, Wellington Management, Hartford Funds.


What's Keeping Us Up at Night

1. The ongoing dangerous situation in Ukraine continues to be monitored by our geopolitical strategists. Ukrainian troops were forced to retreat from the town of Avdiivka, losing a city for the first time in nearly a year. Global shipping disruptions in the Red Sea continued with the sinking the British-owned ship Rubymar, which was carrying a cargo of fertilizer. In addition to the potential environmental damage, we continue to observe upward pressure on freight-shipping insurance and near-term pressure on freight rates.

2. While Congress has continued to avert a US government shutdown, it will still need to work toward a longer-term solution. Our concern is that the current House Speaker has an extremely thin margin of votes and is at the mercy of small portions of his caucus. Government legislation, in normal times a slow process, may prove particularly challenging in the coming months.

3. High-yield5 corporate default rates increased to a cycle high of 5.7% at the end of January (FIGURES 5 and 6). We believe default rates have come close to reaching a peak and expect fundamentals to weaken only modestly over the next year as earnings likely decline. However, we don’t see a full-scale default cycle on the horizon given the higher-quality composition of the high-yield market relative to past cycles. High-yield spreads6 have tightened inside the 20th percentile relative to history, and don't offer a lot of cushion should defaults remain elevated or if a soft-landing fails to materialize. Indeed, despite the uptick in the default rate, CCC7 spreads tightened more than other high-yield sub-indices.


Government legislation, in normal times a slow process, may prove particularly challenging in the coming months.


FIGURE 5 and 6

High-Yield Spreads Have Already Compressed in Anticipation of Lower Defaults
Left: High-Yield Default Rate and Spreads (%); Right: High-Yield Spreads by Credit Rating (%)

Left: As of 2/29/24. Data: Moody's Investors Service Trailing 12-month Speculative-Grade US Corporate Default Rate, Bloomberg US High Yield Index OAS.8 Right: As of 3/1/24. Data: Bloomberg US High Yield Index. Data Sources: Moody's, Bloomberg, Wellington Management, Hartford Funds.


Investment Implications for Consideration

  • Given how drawn out and uncertain the rate cycle has been, we still favor higher-quality total-return strategies that are less constrained by benchmarks. These could include global sovereign and currency strategies that potentially shine during these periods or “go-anywhere9” strategies that may be able to navigate the late cycle.
  • We acknowledge the tumult of rate markets this year. But, given where spread levels are in many sectors, core-bond and core-bond-plus10 positions may make sense as we emerge from the end of the tightening cycle. The gradual cooling of inflation and slowing of the economy makes higher-quality fixed income potentially attractive from a recessionary perspective, as well as for positive convexity.11  These strategies also make sense as a way to mitigate the risk of a hawkish policy mistake by the Fed (i.e., if the central bank leaves policy rates too high for too long).
  • Securitized credit12 could be a potential hedge against rate volatility since it generally offers attractive risk-adjusted spreads. Senior parts of the capital structure, in particular, seem attractive in case the cycle turns faster than expected. 
  • High yield, despite its strong performance in 2023, warrants a cautious approach given how late in the cycle we are and the normalizing of default rates relative to current spreads. However, its robust carry13 may make high yield a good equity substitute. For all higher-yielding credit, including high yield, bank loans, and convertible debt, we favor an “up-in-quality” issuer bias in case the slowing economy undershoots a soft-landing scenario and default/downgrade rates accelerate.


FIGURE 7

Fixed-Income Sector Total and Excess Returns for February

As of 2/29/24. Past performance does not guarantee future results. Indices are unmanaged and not available for direct investment. Excess returns are calculated by taking the return of each individual security in the index and comparing it to a duration-equivalent US Treasury yield. Each security’s contribution to the index excess return is determined by its weight in the index. See below for representative index definitions. Sources: Bloomberg, JP Morgan, and Wellington Management.

FIGURE 8

US Yields (%)

As of 2/3/24. Sources: Bloomberg, Wellington Management.

FIGURE 9

Fixed-Income Spreads (basis points)16

As of of 2/29/24. US IG Corporates are represented by the Bloomberg US Corporate Bond Index; US HY Corporates are represented by the Bloomberg US Corporate High Yield Bond Index; EMD is represented by the J.P. Morgan EMBI Global Diversified Index; MBS is represented by the Bloomberg US MBS Index; Bank Loans are represented by the Morningstar/LSTA US Leveraged Loan Index. See below for representative index definitions. Sources: Bloomberg, JP Morgan, Morningstar LSTA, Wellington Management.


To learn more about opportunities in fixed income, please talk to your financial representative.


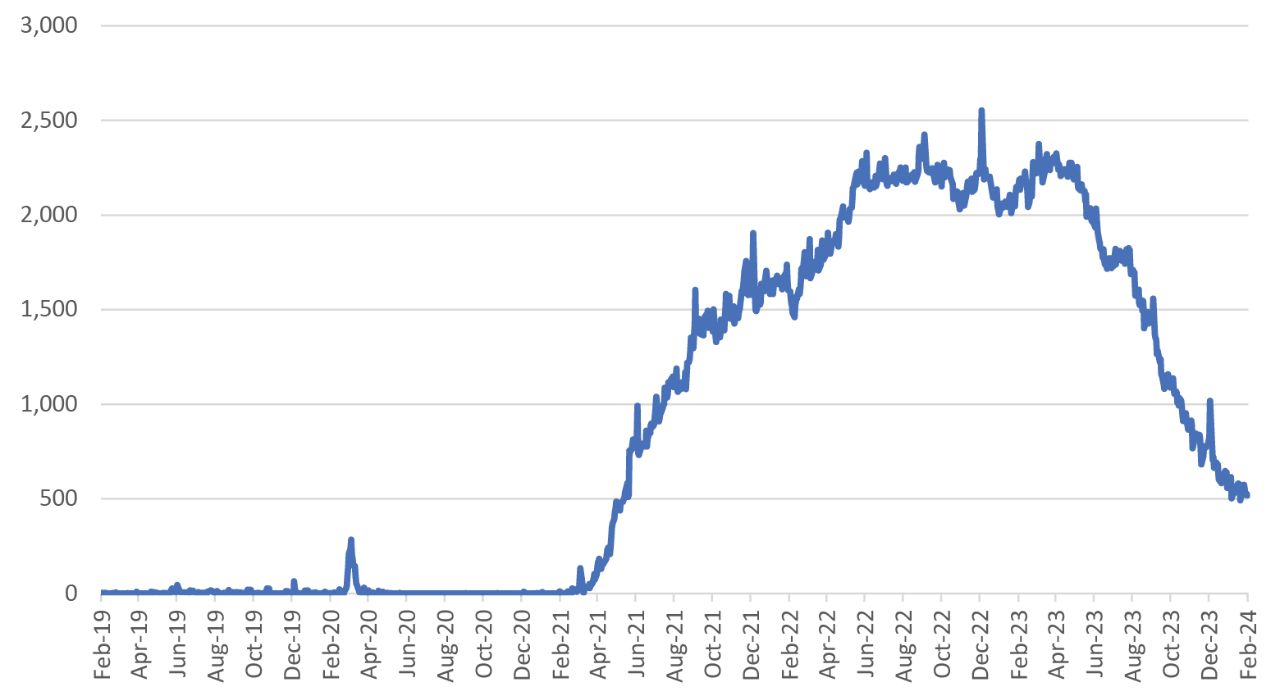
1 The New York Federal Reserve's Open Market Trading Desk (the Desk) is authorized by the Federal Open Market Committee (FOMC) to conduct repurchase agreement (repo) and reverse repo transactions to support effective monetary-policy implementation and help maintain the federal funds rate within the FOMC's target rate. In a repo transaction, the Desk purchases securities from a counterparty subject to an agreement to resell the securities later. Conversely, in a reverse repo transaction, the Desk sells securities to a counterparty subject to an agreement to repurchase the securities at a later date. Reverse repo transactions temporarily reduce the supply of reserve balances in the banking system. The Overnight Reverse Repo Facility (ON RRP) helps provide a floor under overnight interest rates by providing an alternate investment option for money market investors when rates fall below the reserve-balances rate (i.e., the rate paid to depository institutions on balances maintained at Federal Reserve Banks).

2 The Fed bought Treasury debt and mortgage-backed securities in quantitative-easing (QE) programs adopted following the 2008 financial crisis. To start reducing its balance sheet, the Fed doesn't need to sell those securities; it can merely choose not to reinvest some or all of the proceeds as the debt matures and is repaid. QE is a form of monetary policy in which the Fed purchases securities from the open market to reduce interest rates and increase the money supply.

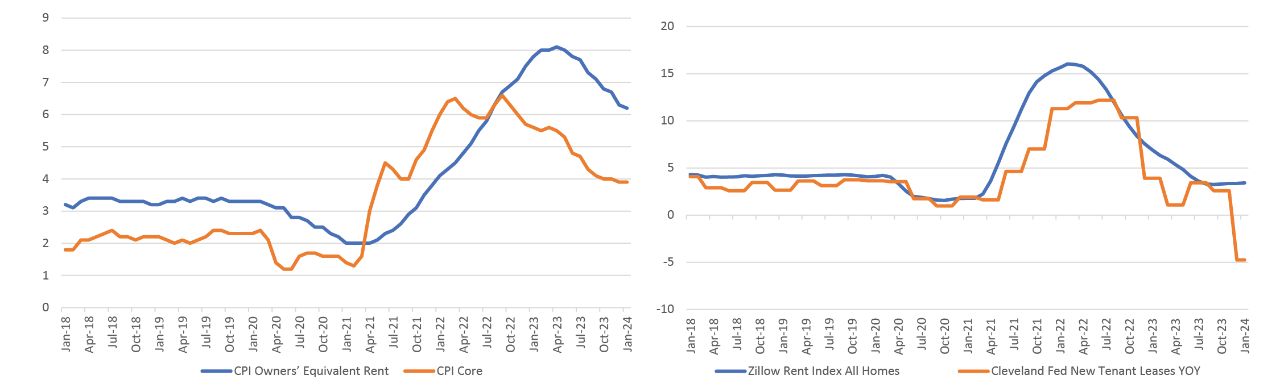
3 Owners’ equivalent rent measures how much money a property owner would have to pay in rent to be equivalent to their cost of ownership.

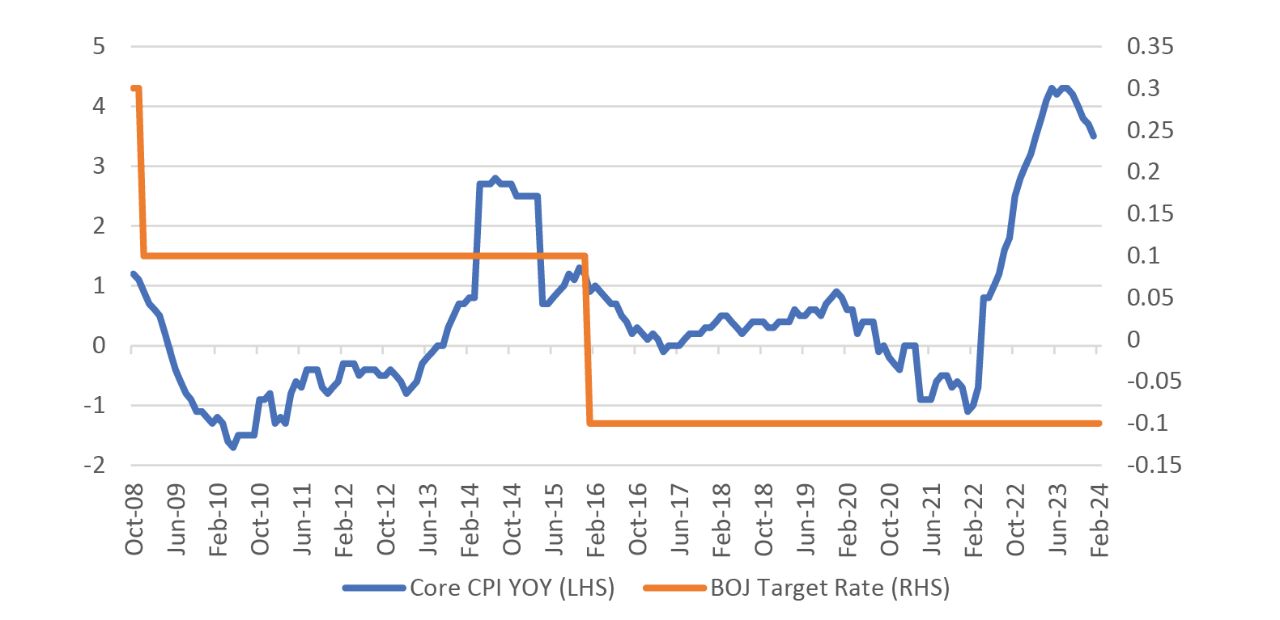
4 The Consumer Price Index (CPI) is a measure of change in consumer prices as determined by the US Bureau of Labor Statistics. Personal consumption expenditures (PCE) is a measure of the spending on goods and services by people in the US as determined by the US Bureau of Economic Analysis.

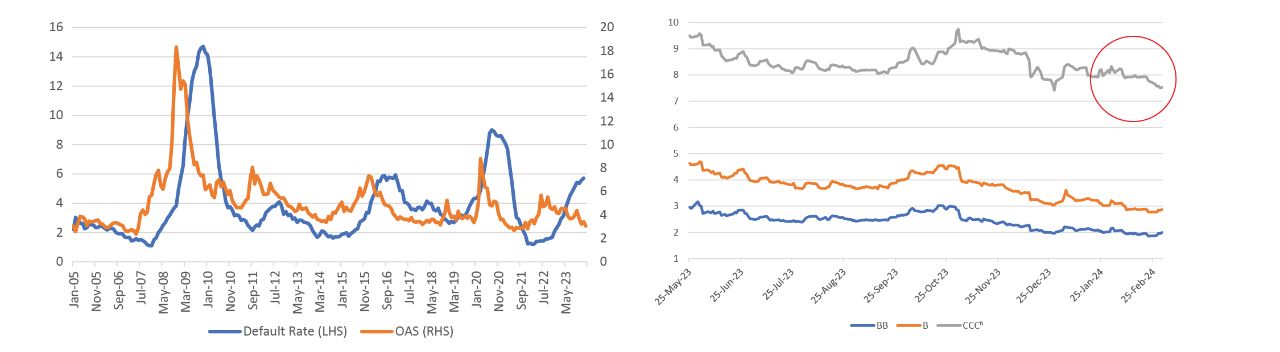
5 High-yield (HY) securities, or "junk bonds," are rated below-investment-grade because there is a greater possibility that the issuer may be unable to make interest and principal payments on those securities. 

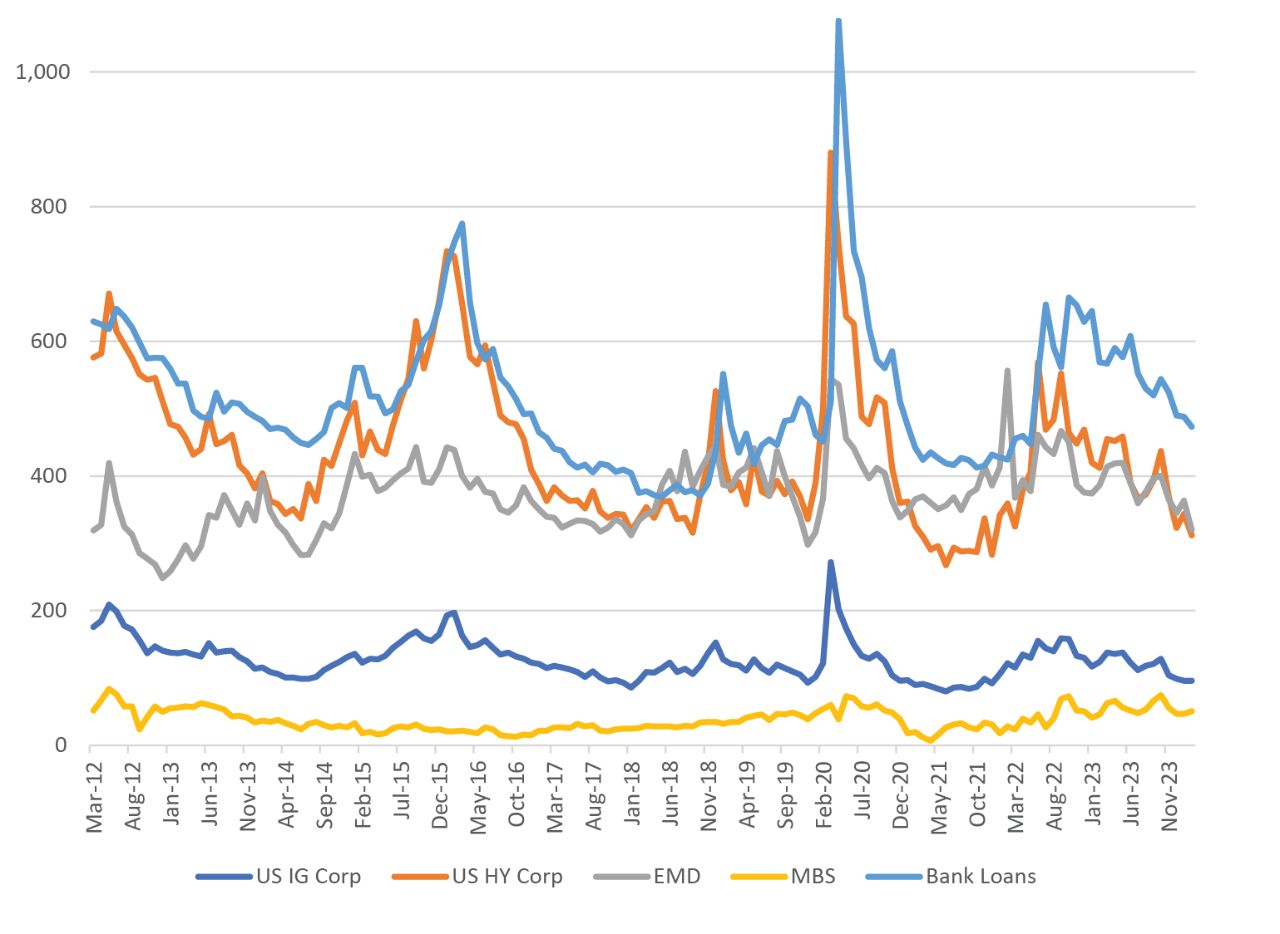
6 Spreads are the difference in yields between two fixed-income securities with the the same maturity but originating from different investment sectors.

7 CCC credit rating is considered to be speculative or junk grade, indicating that the issuer has a high risk of defaulting on its debt obligations. BB is the bond rate given to debt instruments that are generally considered speculative in nature. B ratings indicate that material default risk is present and capacity for continued payment is vulnerable to deterioration in the business and economic environment, but a limited margin of safety remains.

8 The option-adjusted spread (OAS) is the measurement of the spread of a fixed-income security rate and the risk-free rate of return, which is then adjusted to take into account an embedded option. Typically, an analyst uses Treasury yields for the risk-free rate.

9 Go-anywhere strategies are typically benchmark-agnostic and not bound by limits on exposure by sector, quality, currency, or country. Whereas traditional core-bond-plus strategies generally have flexibility to invest across the fixed-income landscape, they generally have upper limits on the amount that can be invested in securities rated below-investment-grade, domiciled outside the US, non-US-dollar-denominated, or reside in a particular sector (e.g., emerging markets).

10 Core/core plus strategies typically invest in a baseline of investment-grade bonds such as government, corporate, and securitized debt. Core-plus funds can take that baseline and add additional sectors such as corporate high-yield, emerging-market debt, or non-US currency exposures to enhance returns.

11 Convexity is the relationship between bond prices and bond yields.

12 Securitized credit involves pooling a large number of loans into an investable asset. Examples include mortgage-backed or asset-backed securities.

13 Carry is the difference between the yield on a longer-maturity bond and the cost of borrowing.

14 Emerging-market bonds (EMD) are debt instruments issued by developing countries. These bonds tend to offer higher yields than Treasuries or corporate bonds in the US. Emerging-market issues tend to carry higher risks than domestic debt instruments.

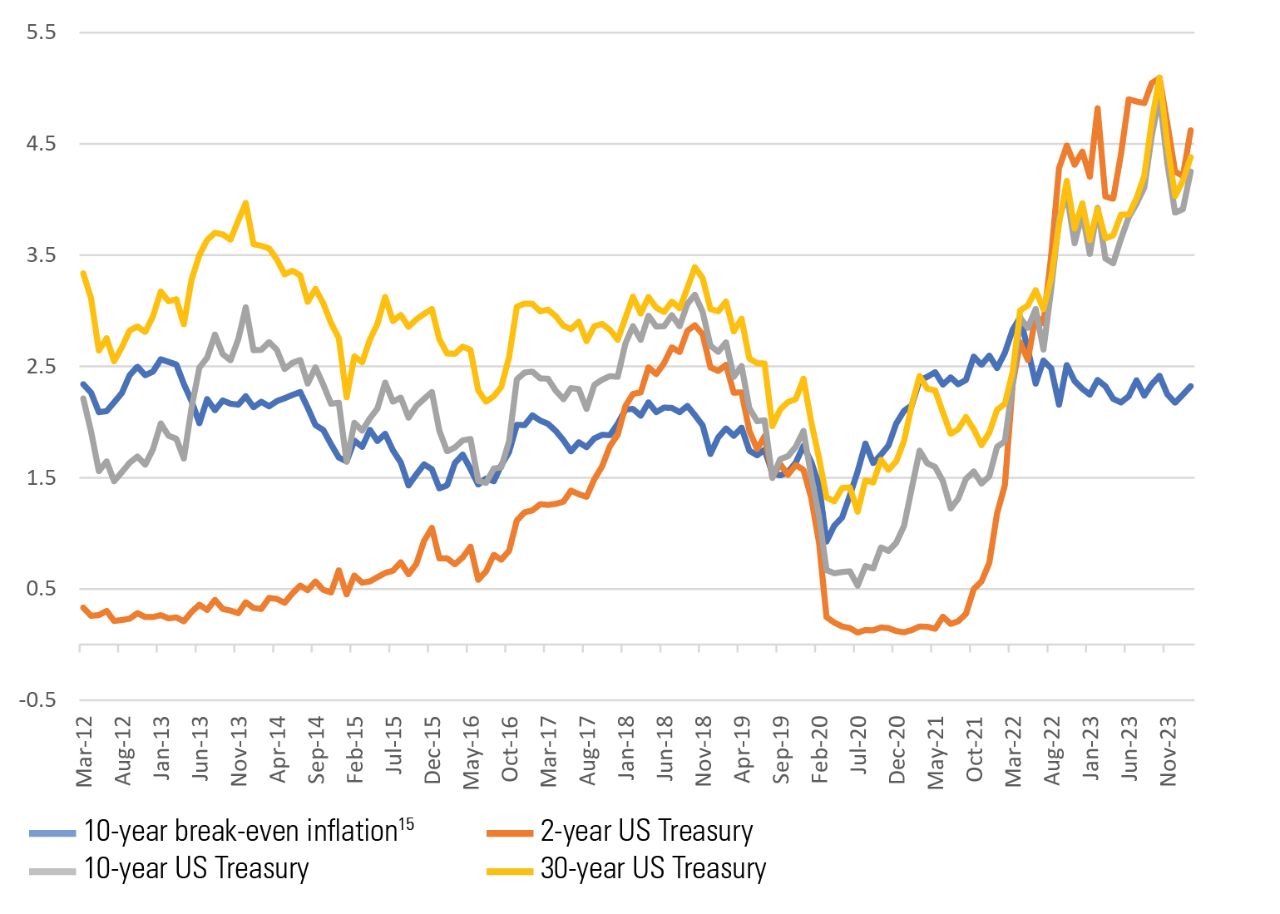
15 The break-even inflation rate is a measurement that aims to predict the effects of inflation on certain investments, by analyzing known market inflation rates from recent years. It can be calculated by comparing the yield of an inflation-based bond (such as Treasury Inflation-Protected Securities, or TIPS) with a nominal bond of the same maturity period. The difference represents the break-even inflation rate, or the rate that inflation would have to be for an investor to “break even” – or earn the same return – between purchasing TIPS or nominal Treasuries.

16 A basis point (bps) is a unit that is equal to 1/100th of 1% and is used to denote the change in a financial instrument. The basis point is commonly used for calculating changes in interest rates, equity indices, and the yield of a fixed-income security.


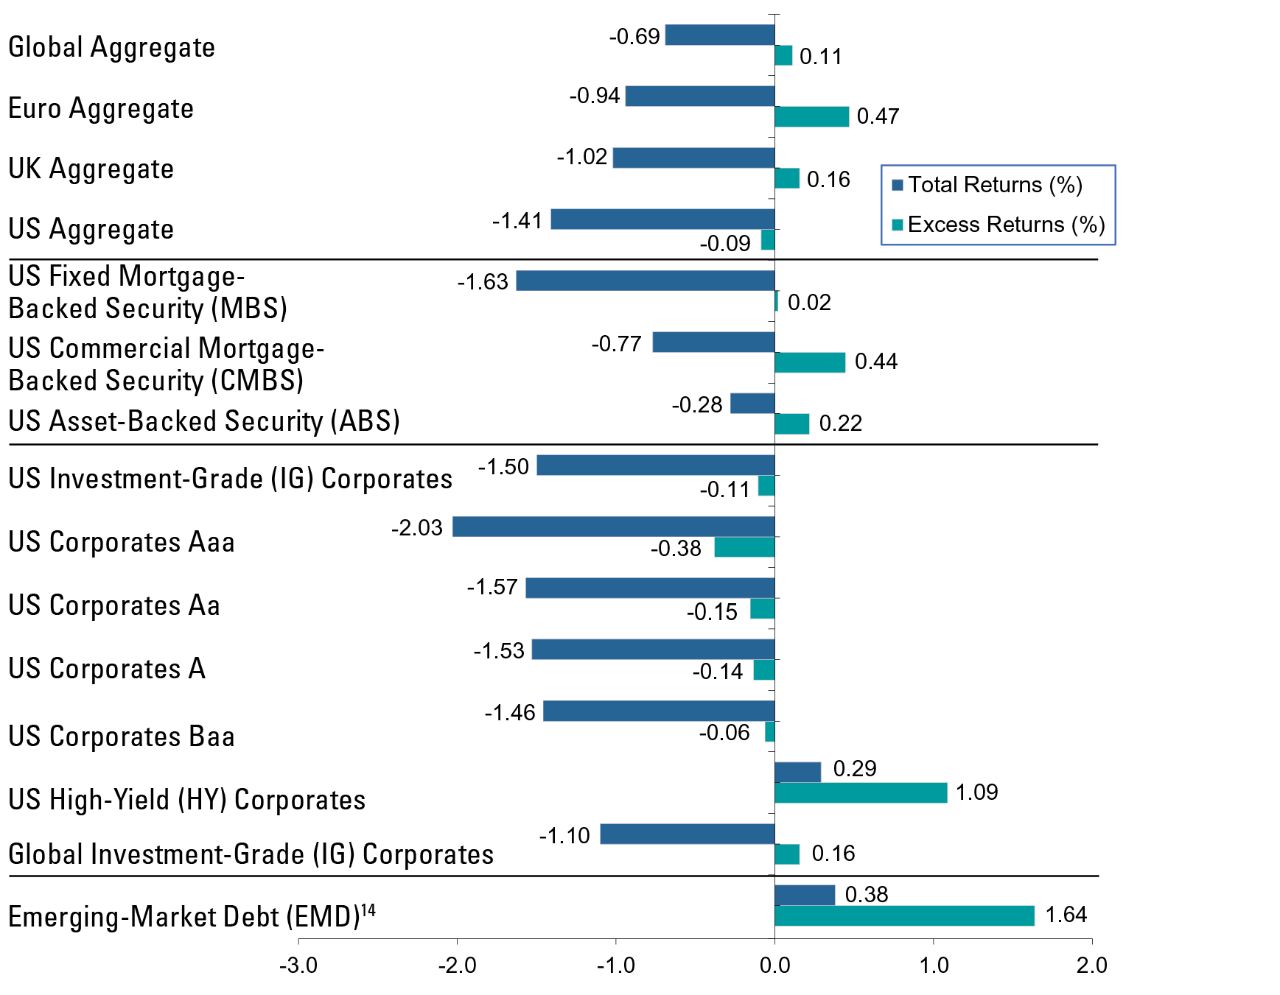
Representative Indices from Figure 7:

Global Aggregate: Bloomberg Global Aggregate Index; Euro Aggregate: Bloomberg Global Aggregate Index - European Euro; UK Aggregate: Bloomberg Global Aggregate Index - United Kingdom; US Aggregate: Bloomberg US Aggregate Bond Index; US Fixed MBS: Bloomberg US MBS Index; US CMBS: Bloomberg CMBS ERISA Eligible Index; US ABS: Bloomberg Asset-Backed Securities Index; US IG Corporates: Bloomberg US Corporate Bond Index; US Corporates Aaa: Bloomberg Aaa Corporate Index; US Corporates Aa: Bloomberg Aa Corporate Index; US Corporates A: Bloomberg A Corporate Index; US Corporates Baa: Bloomberg Baa Corporate Index; US High-Yield Corporates: Bloomberg US Corporate High Yield Bond Index; Global IG Corporates: Bloomberg Global Credit - Corporate Index; Emerging-Markets Debt: Bloomberg Emerging Markets Hard Currency Index.


Index Definitions:

Bloomberg Global Aggregate Index is a broad-based measure of the global investment-grade fixed-rate debt markets. Bloomberg Global Aggregate Index - European Euro includes fixed-rate, investment-grade Euro denominated bonds. Bloomberg Global Aggregate Index - United Kingdom includes fixed-rate, investment-grade sterling-denominated bonds. Bloomberg US Aggregate Bond Index is composed of securities from the Bloomberg Government/Credit Bond Index, Mortgage-Backed Securities Index, Asset-Backed Securities Index, and Commercial Mortgage-Backed Securities Index. Bloomberg US MBS Index tracks fixed-rate agency mortgage backed passthrough securities guaranteed by Ginnie Mae (GNMA), Fannie Mae (FNMA), and Freddie Mac (FHLMC). Bloomberg CMBS ERISA Eligible Index measures the performance of investment-grade commercial mortgage-backed securities, which are classes of securities that represent interests in pools of commercial mortgages. The index includes only CMBS that are Employee Retirement Income Security Act of 1974. Bloomberg Asset-Backed Securities Index, the ABS component of the Bloomberg US Aggregate Index, has three subsectors: credit and charge cards, autos, and utility. Bloomberg US Corporate Bond Index covers all publicly issued, fixed rate, nonconvertible, investment-grade debt. Bloomberg Aaa Corporate Index is designed to measure the performance of investment-grade corporate bonds that have a credit rating of Aaa. Bloomberg Aa Corporate Index is designed to measure the performance of investment-grade corporate bonds that have a credit rating of Aa. Bloomberg A Corporate Index is designed to measure the performance of investment-grade corporate bonds that have a credit rating of A. Bloomberg Baa Corporate Index is designed to measure the performance of investment-grade corporate bonds that have a credit rating of Baa. Bloomberg US Corporate High Yield Bond Index is an unmanaged broad-based market-value-weighted index that tracks the total return performance of non-investment grade, fixed-rate, publicly placed, dollar denominated and nonconvertible debt registered with the Securities and Exchange Commission. Bloomberg Global Credit - Corporate Index is an unmanaged index considered representative of fixed rate, non-investment grade debt of companies in the US, developed markets, and emerging markets. Bloomberg Emerging Markets Hard Currency Index includes USD-denominated debt from sovereign, quasi-sovereign, and corporate EM issuers. J.P. Morgan EMBI Global Diversified Index is a broad-based, unmanaged index which tracks liquid, US Dollar emerging-market fixed- and floating-rate debt instruments issued by sovereign and quasi-sovereign entities. Morningstar/LSTA Leveraged Loan Index is a market-value-weighted index that is designed to measure the performance of the US leveraged loan market based upon market weightings, spreads, and interest payments. 

Important Risks: Investing involves risk, including the possible loss of principal. • Fixed income security risks include credit, liquidity, call, duration, and interest-rate risk. As interest rates rise, bond prices generally fall. • Investments in high-yield (“junk”) bonds involve greater risk of price volatility, illiquidity, and default than higher-rated debt securities. • Mortgage-related and asset-backed securities’ risks include credit, interest-rate, prepayment, and extension risk. The value of the underlying real estate of real estate related securities may go down due to various factors, including but not limited to strength of the economy, amount of new construction, laws and regulations, costs of real estate, availability of mortgages, and changes in interest rates. • Loans can be difficult to value and less liquid than other types of debt instruments; they are also subject to nonpayment, collateral, bankruptcy, default, extension, prepayment and insolvency risks. • Foreign investments may be more volatile and less liquid than US investments and are subject to the risk of currency fluctuations and adverse political, economic and regulatory developments. These risks may be greater, and include additional risks, for investments in emerging markets. 

The views expressed herein are those of Wellington Management, are for informational purposes only, and are subject to change based on prevailing market, economic, and other conditions. The views expressed may not reflect the opinions of Hartford Funds or any other sub-adviser to our funds. They should not be construed as research or investment advice nor should they be considered an offer or solicitation to buy or sell any security. This information is current at the time of writing and may not be reproduced or distributed in whole or in part, for any purpose, without the express written consent of Wellington Management or Hartford Funds.


FIOWP018 3446235
Insight from sub-adviser Wellington Management
Author Headshot
Managing Director at Wellington Management LLP and Fixed-Income Strategist for Hartford Funds


The material on this site is for informational and educational purposes only. The material should not be considered tax or legal advice and is not to be relied on as a forecast. The material is also not a recommendation or advice regarding any particular security, strategy or product. Hartford Funds does not represent that any products or strategies discussed are appropriate for any particular investor so investors should seek their own professional advice before investing. Hartford Funds does not serve as a fiduciary. Content is current as of the publication date or date indicated, and may be superseded by subsequent market and economic conditions.

Investing involves risk, including the possible loss of principal. Investors should carefully consider a fund's investment objectives, risks, charges and expenses. This and other important information is contained in the mutual fund, or ETF summary prospectus and/or prospectus, which can be obtained from a financial professional and should be read carefully before investing.

Mutual funds are distributed by Hartford Funds Distributors, LLC (HFD), Member FINRA|SIPC. ETFs are distributed by ALPS Distributors, Inc. (ALPS). Advisory services may be provided by Hartford Funds Management Company, LLC (HFMC) or its wholly owned subsidiary, Lattice Strategies LLC (Lattice). Certain funds are sub-advised by Wellington Management Company LLP and/or Schroder Investment Management North America Inc (SIMNA). Schroder Investment Management North America Ltd. (SIMNA Ltd) serves as a secondary sub-adviser to certain funds. HFMC, Lattice, Wellington Management, SIMNA, and SIMNA Ltd. are all SEC registered investment advisers. Hartford Funds refers to HFD, Lattice, and HFMC, which are not affiliated with any sub-adviser or ALPS. The funds and other products referred to on this Site may be offered and sold only to persons in the United States and its territories.

© Copyright 2024 Hartford Funds Management Group, Inc. All Rights Reserved. Not FDIC Insured | No Bank Guarantee | May Lose Value