• Products
  • Insights
  • Practice Management
  • Resources
  • About Us

Private equity has long been sought by institutional investors for its attractive risk/return profile and its relatively low correlation1 to other asset classes, making it a desirable investment from a diversification standpoint and long-term growth potential. While it may seem complex and carry a certain “mystique,” in simple terms, it’s a way to gain exposure to nonpublic companies that don’t trade on an exchange. Many well-known companies are either currently private or have received private-equity backing early in their business lifecycle ahead of their eventual initial public offering (IPO).

But the number of public companies has been declining over the years, paving the way for a growing private-company universe (FIGURE 1). In addition, more private companies have delayed going public, creating an opportunity set that’s both large and global in nature. There are around 359 million private companies in the world2 compared to roughly 44,000 public companies.3


Figure 1

Companies Have Remained Private Longer
IPOs and Publicly Listed Companies Since 1980

Bar graph showing the downtrend of IPOs each year

As of 7/8/24. Chart represents US data. Data Sources: Jay Ritter “Initial Public Offerings: Updated Statistics” (IPOs, left axis), World Bank (publicly listed companies, right axis), and Schroders Capital, 6/25.


Risk/Return Profile

One characteristic that makes private-equity investing desirable is the return potential over time. Private-equity investing has yielded higher returns than various public-equity-market segments, and outpaced fixed income since 2001, while also offering compelling risk-adjusted measures of return (FIGURE 2).


Figure 2

Private Equity’s Return Potential
Return (%) and Sharpe Ratio (2001-2024)

Bar graph comparing the retuns and Sharpe ratio of private equity, S&P 500 Index, Russel 2000 Index, MSCI EAFE Index, and Bloomberg US Aggregate Bond Index

Past performance does not guarantee future results. Indices are unmanaged and not available for direct investment. Sharpe Ratio is a measure of the excess fund returns per unit of risk, as measured by standard deviation. Private equity is represented by the Preqin Private Equity Index. Please see below for index definitions. For illustrative purposes only. Data Sources: Morningstar, Preqin, and Schroders, 6/25.


The components of increased return potential stem from several factors including an illiquidity/complexity premium,4 information availability/mispricing, increased operational control, and lack of shareholder influence.   


Within the broad private-equity category and its various sub-categories, dispersion between top-quartile and bottom-quartile managers can be quite wide.


Another important aspect of return potential for private-equity investors is manager selection. Within the broad private-equity category and its various sub-categories, dispersion5 between top-quartile and bottom-quartile managers can be quite wide (FIGURE 3). Therefore, it’s important that an investor choose a private-equity franchise that has a history of generating value for its investors, coupled with the resources, experience, and network to access the global opportunity set of private companies.


Figure 3

Dispersion Within the Private-Equity Category Varies

Chart depicting the dispersion within private-equity categories

As of 12/31/20. Chart depicts dispersion in returns between top quartile and bottom quartile. More recent vintages have been excluded as it typically takes five years for a buyout portfolio to develop. Data Sources: Cambridge Associates, 6/25.

The diversification properties of private markets may be especially valuable during periods of market stress.


Diversification

Private-equity investing has a relatively low correlation to traditional investments, such as public equity and fixed income (FIGURE 4). Private investments generally have a longer time horizon and a focus on long-term value creation, rather than the quarter-to-quarter focus common in public markets. Since private-equity investments don’t trade on an exchange, valuations tend to experience a smoothing effect as they aren’t marked daily as with public markets. This diversification property may become especially valuable during periods of public-market stress, when investors want to shed risk, which can end up pushing the valuations of public companies lower.


Figure 4

Low Correlation Makes Private Equity an Attractive Diversifier
Correlation Matrix (1/1/01-12/31/24)

  Private
Equity
S&P 500
Index
Russell
2000
Index
MSCI
EAFE
Index
Bloomberg
US Aggregate
Bond Index
Private Equity 1.00        
S&P 500 Index 0.65 1.00      
Russell 2000 Index 0.59 0.91 1.00    
MSCI EAFE Index 0.65 0.88 0.85 1.00  
Bloomberg US Aggregate Bond Index -0.18 -0.06 -0.09 0.03 1.00

Past performance does not guarantee future results. Indices are unmanaged and not available for direct investment. Private equity is represented by the Preqin Private Equity Index. For illustrative purposes only. Data Sources: Morningstar, Preqin, and Schroders, 6/25.


Incorporating Private Equity into an Allocation

Many non-institutional investors have attempted to imitate the allocation framework used by college endowments and large pension plans, but one must consider that these entities have a presumably infinite time horizon and ability to withstand short-term volatility and any potential losses of capital. While endowments and pension plans have been known to allocate up to 30% of their allocation to private equity, this is likely imprudent for high-net-worth investors who may have a finite time horizon, differing risk tolerances, and liquidity needs.

If one uses the standard 60%/40% portfolio as a starting point and wants to incorporate private equity into their asset allocation, the scenarios below can be used as a starting point (FIGURE 5). Funding a private-equity allocation from public equity can offer a reduced risk profile while offering a higher return potential and improved Sharpe ratio; this highlights the diversification benefits from the inclusion of private equity into a portfolio. Conversely, funding private equity from the fixed-income allocation also has the potential to increase return profile, but comes at the expense of an increased risk profile and less optimal Sharpe ratio-outcomes.


Figure 5

Diversifying with Private Equity May be Beneficial

  Annualized
Return (%)
Standard
Deviation
Sharpe
Ratio
Max
Drawdown
60% Equity/40% Bonds 6.92
9.47
0.57 -32.02
55% Equity/40% Bonds/5% Private Equity 7.06
8.85
0.62
-30.60
50% Equity/40% Bonds/10% Private Equity 7.20
8.27
0.67
-29.15
60% Equity/35% Bonds/5% Private Equity 7.29
9.54
0.61
-33.26
60% Equity/30% Bonds/10% Private Equity 7.66
9.64 0.64
-34.50

Chart Data: 2001-2024. Past performance does not guarantee future results. Indices are unmanaged and not available for direct investment. Equity is represented by the S&P 500 Index, bonds by the Bloomberg US Aggregate Bond Index, and private equity by the Preqin Private Equity Index. Standard deviation measures the portfolio’s total-return volatility. A higher standard deviation indicates greater historical volatility For illustrative purposes only. Data Sources: Morningstar, Preqin, and Schroders, 6/25.

Tender-Offer Structure

While private equity can provide many potential benefits, individual investors have historically faced challenges accessing the asset class. The tender-offer fund structure provides a solution that opens up participation to a broader investor audience.

Private equity has traditionally been structured through private fund offerings, rather than as SEC-registered funds, thereby making them less accessible. Some typical and more burdensome characteristics of unregistered private funds include:

  • Very high investment minimums (frequently $1 million or more)
  • Long lock-up periods6 (often 7-10 years) with no interim liquidity
  • Unpredictable capital calls7
  • Late tax reporting (Schedule K-1)
  • Less frequent performance reporting (typically quarterly)

As a result of these structural limitations, private equity has traditionally been used almost exclusively by large institutional investors and ultra-high-net-worth individuals. This is where the tender-offer fund vehicle comes into the picture.

A tender-offer fund is an SEC-registered, closed-end fund that’s generally unlisted and provides periodic shareholder liquidity through tender offers. Since it isn’t subject to the 15% limit on illiquid securities to which mutual funds and ETFs must adhere, a tender-offer fund can invest more substantially in private equity, while also providing the following benefits that come with SEC registration:

  • Lower investment minimums (often $25,000)
  • Monthly subscriptions without capital calls
  • Periodic liquidity at net asset value (tender offers typically conducted quarterly for up to 5% of fund net assets)8
  • Improved tax reporting (Form 1099)
  • Monthly performance reporting

Tender-offer funds can streamline the investment process for shareholders and are considered evergreen, enabling investors to subscribe in any given month and add to existing positions over time, with each subscription fully funded up-front. Conversely, unregistered private funds have limited offering windows, subsequent drawdowns, and stated end dates. This typically requires investors to develop and implement a complicated commitment plan in order to maintain their desired private-equity allocations. 

While most tender-offer funds seek to provide quarterly liquidity for up to 5% of net assets, they aren’t required to provide shareholder liquidity. As a result, these types of funds are meant to be long-term investments and aren’t intended for investors with short-term liquidity needs.

While the tender-offer structure eliminates many of the hurdles in accessing private equity, individual investors should still consider seeking out a skilled manager with long-nurtured relationships in the private-equity marketplace.


Summary

Private equity investing offers a large and growing opportunity set with attractive risk-and-return enhancements to a diversified portfolio. Though private-equity investing has historically been utilized by large pension plans, foundations, and endowments, the tender-offer structure provides the benefits of private equity to a wider range of investors. For investors that may benefit from an allocation to private equity, the tender-offer structure alleviates several drawbacks to traditional private-equity investing, such as high minimums, lock-ups, illiquidity, and extra tax-reporting complexity.


To learn more about our closed-end fund approach to private equity, please contact your Hartford Funds representative.


1 Correlation is a statistical measure of how two investments move in relation to each other. A correlation of 1.0 indicates the investments have historically moved in the same direction; a correlation of -1.0 means the investments have historically moved in opposite directions; and a correlation of 0 indicates no historical relationship in the movement of the investments.

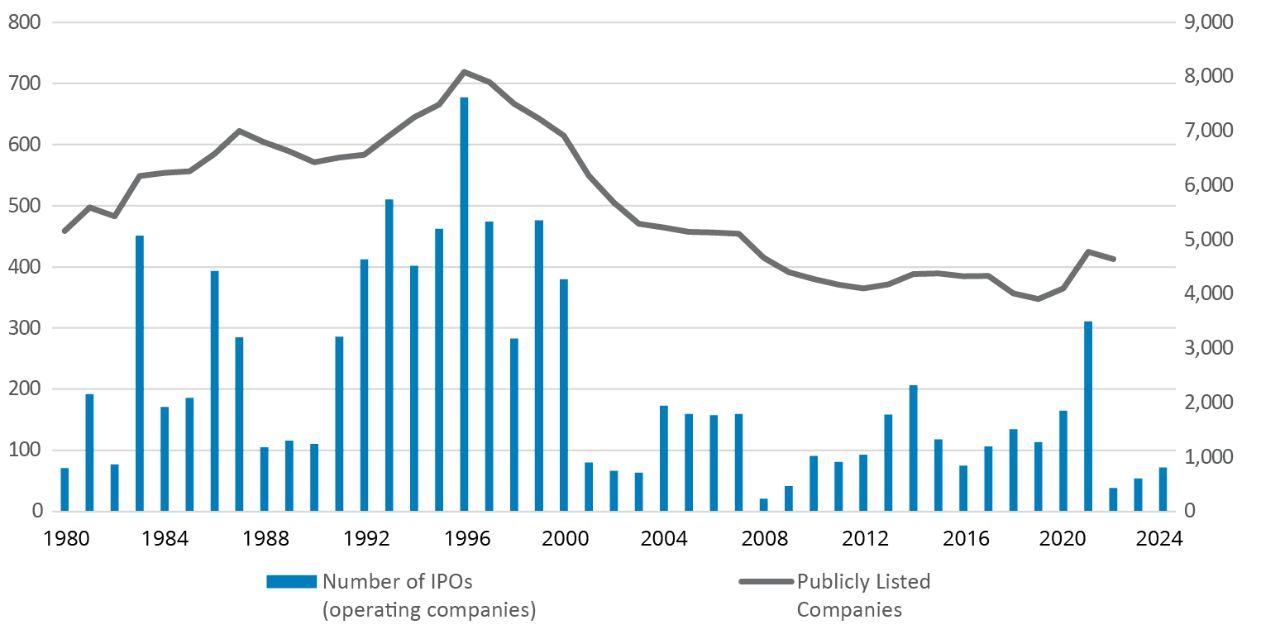
2 Statista, total companies worldwide, 2023.

3 OECD, 2022/2019.

4 The illiquidity/complexity premium refers to the additional return investors may earn for taking on the risks associated with investing in assets that are harder to buy or sell quickly (illiquid) and more difficult to understand or manage (complex). This premium compensates for challenges like limited market access, less transparency, and greater operational demands.

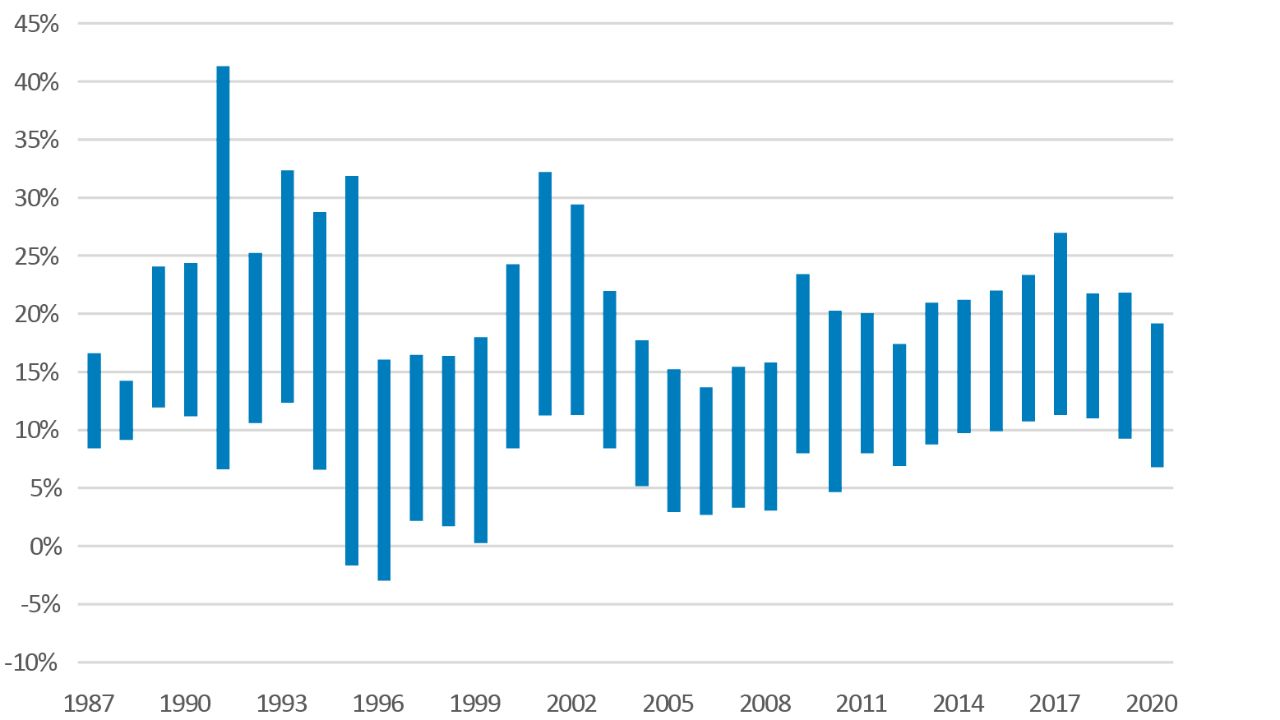
5 Dispersion refers to the wide range of returns among private equity managers—meaning some perform exceptionally well, while others may significantly underperform.

6 Lock-up periods are the time investors must commit their money to a fund without being able to withdraw it

7 Capital calls are when a private-equity fund asks investors to send in part of the money they committed, usually as new investments arise. Instead of paying everything upfront, investors fund these calls over time and need cash ready when asked.

8 Tender offers are subject to the approval of a fund’s Board of Trustees. Shareholders generally will not have the right to require a fund to repurchase shares. A 2% early repurchase fee is often imposed on tendered shares held less than one year.

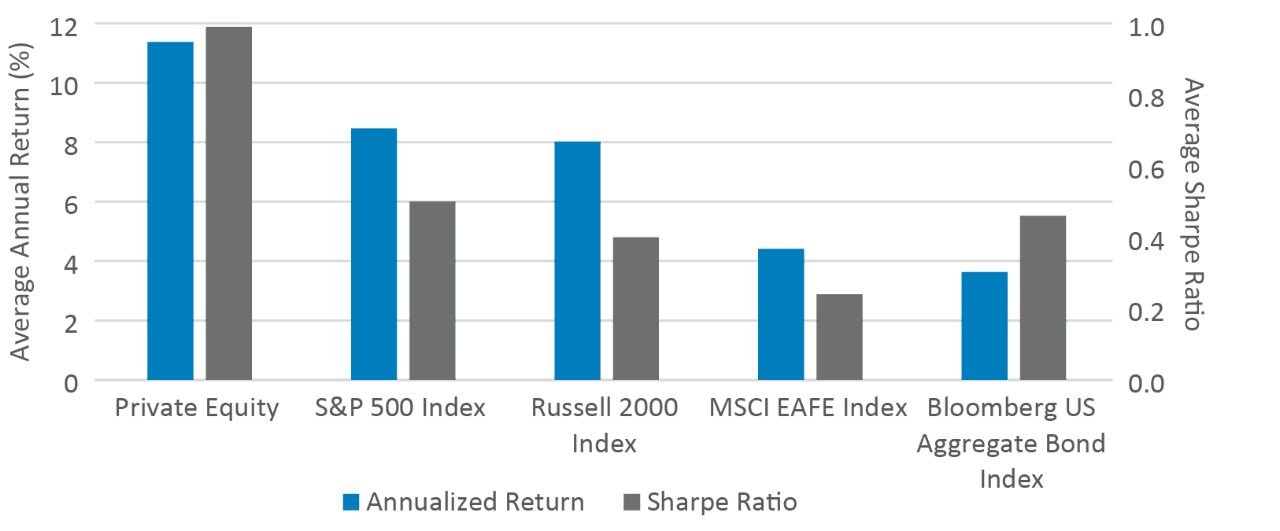
Bloomberg US Aggregate Bond Index is composed of securities that cover the US investment-grade fixed-rate bond market, with index components for government and corporate securities, mortgage pass-through securities, and asset-backed securities.

MSCI EAFE Index is a free float-adjusted capitalization index that is designed to measure developed-market equity performance and excludes the US and Canada.

Preqin Private Equity Index is a benchmark that tracks the net performance of global private equity funds using real cash flow data, offering a clear view of how the asset class performs over time. It reflects the actual returns received by investors after fees.

Russell 2000 Index measures the performance of the small-cap segment of the US equity universe.

S&P 500 Index is a market capitalization-weighted price index composed of 500 widely held common stocks.

Important Risks: Investing involves risk, including the possible loss of principal. • Private equity investments involve a high degree of business and financial risk that can result in substantial losses. The valuation of private equity investments is complex and is typically based on fair value. • Illiquid and restricted securities may be difficult to dispose of at a fair price. A particular investment may become illiquid, making it difficult to sell that investment at an advantageous time or price. • Foreign investments may be more volatile and less liquid than US investments and are subject to the risk of currency fluctuations and adverse political, economic, and regulatory developments.
Diversification does not eliminate the risk of experiencing investment losses.

The views expressed here are those of the authors and should not be construed as investment advice. They are based on available information and are subject to change without notice. Portfolio positioning is at the discretion of the individual portfolio management teams; individual portfolio management teams, and different fund sub-advisers, may hold different views and may make different decisions for different clients or portfolios. This material and/or its contents are current as of the time of writing and may not be reproduced or distributed in whole or in part, for any purpose, without the express written consent of Hartford Funds.


WP801 4904798
About The Authors
Author Headshot
Neil Patton, CFA, CAIA
Investment Specialist, US Equity, Hartford Funds
Author Headshot
Senior Director, Product Management, Hartford Funds