• Products
  • Insights
  • Practice Management
  • Resources
  • About Us

Listen to Amar’s June Commentary

Navigating by Stars Under a Cloudy Sky

What's Driving Markets...
1. Global central banks chartered different paths toward policy normalization, as the Federal Reserve (Fed), Bank of Japan (BOJ), and European Central Bank (ECB) deal with differing inflation dynamics in their respective regions (FIGURE 1).

  1. The Fed: Governor Waller recently made a speech in which he offered several explanations on why he thinks r-star,1 or the neutral rate of interest (the neutral real federal-funds rate after accounting for cyclical ups and downs), has not moved structurally higher. This is an important comment. Recent discussion in central-bank policy circles regarding a structurally higher r-star could indicate that policy is not as restrictive as initially thought by the Federal Open Market Committee (FOMC).2 In the near term, however, one can interpret the Waller speech as somewhat dovish.

  2. Bank of Japan: The BOJ continues to grapple with the gradual exit of its extraordinary monetary policy. Japanese government-bond yields rose over the month as the market attempted to divine the BOJ’s next step. A surprise cut in mid-month bond-buying operations spooked yields upward to near-decade highs. Moreover, the depreciation of the yen (which already has been heavily supported via foreign-exchange intervention by Japanese authorities) puts some additional pressure on the BOJ for a June hike. Thus far, the BOJ’s tone has been calm and measured with verbiage stating the end of deflation was in sight.

  3. European Central Bank: Conversely, the ECB has already initiated a first quarter-point cut to its policy rate, as euro-area growth and inflation diverge from the US.


Listen to Amar’s June Commentary

Navigating by Stars Under a Cloudy Sky

FIGURE 1

Major Developed Sovereign-Yield3 Changes Show a Divergent Cycle
May 2024 Yield Changes by Maturity (basis points4)

As of 5/31/24. Sources: Bloomberg, Wellington Management, and Hartford Funds.


2. The Chinese government is rolling out more active stimulus measures in a bid to shore up the domestic economy—but, in particular, the property market. The central government, via issuance of long-dated debt, plans to lend the proceeds to state operating enterprises and local governments to allow those institutions to purchase excess housing. While there’s an echo of the successful US “cash-for-clunkers” auto-stimulus program during the Global Financial Crisis (GFC), that was a relatively small program to pull demand forward in a troubled sector of the economy. In this case, the Chinese government seeks to remove a substantial amount of excess supply and then convert some of that supply into social housing. While we await further details to understand the overall impact of the program, we have continued to see a gradual weakening of the renminbi, likely with the tacit approval of Chinese policymakers.


In a bid to shore up the Chinese domestic property market, the central government plans to issue debt and lend the proceeds to state-operated enterprises and local governments to buy excess housing.


3. Turmoil bubbled underneath the surface of the Treasury market:

  • The so-called cash futures basis trade (which seeks to take advantage of differentials in implied financing costs in Treasury futures vs. their underlying cash bonds), has become less attractive to participants. We can see this reflected in the reduction in the enormous short position5 in Treasury futures by speculative accounts (FIGURE 2, left).
  • Treasury auctions during May were somewhat weak. Typically, auction tails6 rarely make news but, in an era of heightened sensitivity to policy rates, they do now. These headlines generated mid-month weakness in the Treasury yield curve.7
  • Dealer balance sheets are full of duration8 at the moment, at five-year highs according to Bloomberg data (FIGURE 2, right).
  • However, most economic data came in somewhat softer or on consensus, allowing yields to decline over the month.


FIGURE 2

The US Treasury's Cash Futures Basis Trade Is Becoming Less Attractive to Traders
Short Futures Positioning (left) vs. Dealer Balance Sheets by Duration Weight (right)

As of 5/31/24. Source: Commodity Futures Trading Commission, Bloomberg, Wellington Management, and Hartford Funds.


4. British Prime Minister Rishi Sunak set a date of July 4 for UK general elections.9 Sunak's Conservative Party is expected to cede power to the opposition Labour Party. This timing likely delays the start of rate cuts by the Bank of England, which may not want to be perceived as influenced by politics—with a November cut around 50% priced into futures markets.


FIGURE 3

UK Inflation and the Bank of England's Policy Rate

As of 5/31/24. Sources: Bloomberg, Wellington Management, and Hartford Funds.


Weaker economic data may open the door for Fed rate cuts. First-quarter growth was revised downward to 1.3% as consumers spent less on goods.


5. Weaker economic data may open the door for Fed rate cuts. First-quarter growth was revised down to 1.3% as consumers spent less on goods. Meanwhile, non-farm payrolls came in shy of estimates while job openings (JOLTS)10 declined, pointing to a continued easing in the labor supply/demand imbalance, while inflation further moderated. Overall, the labor-market data combined with the core Consumer Price Index (CPI) and Personal Consumption Expenditures (PCE)11 Index for April may give the Fed tentative confidence that the labor market is rebalancing and that inflation pressures are continuing to ease. Markets are pricing in the first rate cut in September.


FIGURE 4

US Job Openings and a Key Inflation Gauge Move Lower
Job Openings and Labor Turnover Survey (JOLTS) vs. the PCE Core Inflation Index


As of 4/30/24. Sources: Bureau of Labor Statistics, Bureau of Economic Analysis, Wellington Management, and Hartford Funds.


What's Keeping Us Up at Night...

1. Geopolitical risk remains front and center with prolonged conflicts in the Middle East and Ukraine:

  • Iranian President Ebrahim Raisi was killed in a helicopter crash, the cause of which is still unknown. Because the Supreme Leader, Ali Khamenei, wields the most power, this event is unlikely to meaningfully shift Iran’s foreign or domestic policies. It does create additional uncertainty regarding the overall succession of power in the Iranian government following Khamenei.
  • There appears to be tacit approval for Ukrainian armed forces to conduct limited strikes into Russian territory for counterfire purposes to protect the city of Kharkiv.

2. A Michigan dairy worker tested positive for H5N1, as the bird flu persists in the US dairy market. Animal-to-human transmission remains a concern for public-health officials.

3. Shipping rates are beginning to drift upward again as peak shipping season starts. While we do not expect rates to move as high as they did during the height of the COVID-19 pandemic, increased spot rates could translate back into goods prices.


FIGURE 5

International Shipping Costs Are Picking Up
40-ft. Box Freight Benchmark Rate (US, $)

As of 5/30/24. Sources: Bloomberg, Wellington Management, and Hartford Funds


Investment Implications for Consideration

  • Given how drawn out and uncertain the rate cycle has been, we still favor total-return strategies that are less constrained by benchmarks. These could include global sovereign and currency strategies that potentially shine during these periods, or “go-anywhere”12 strategies that may be able to navigate the late cycle.
  • We acknowledge the tumult of rate markets this year. But, given where spread levels are in many sectors, core-bond and core-bond-plus13 positions could make sense as we approach an easing cycle. The gradual cooling of inflation and slowing of the economy makes higher-quality fixed income potentially attractive from a positive convexity perspective.14
  • Securitized credit15 could be a potential hedge against rate volatility since it generally offers attractive risk-adjusted spreads. Senior parts of the capital structure, in particular, seem attractive in case the cycle turns faster than expected. 
  • High yield16 warrants a cautious approach given how late in the cycle we are and the normalizing of default rates relative to current spreads. However, the robust carry17 may make high yield a good equity substitute. In particular, we favor senior bank loans18 and convertible debt with a bias toward “up-in-quality” issuers.


FIGURE 6

Monthly Fixed-Income Sector Total and Excess Returns

Monthly data as of 5/31/24. Past performance does not guarantee future results. Excess returns are defined as investment returns from a security or portfolio that exceed a benchmark or index with a similar level of risk. Indices are unmanaged and not available for direct investment. See below for representative index definitions. Sources: Bloomberg and Wellington Management

FIGURE 7

US Yields (%)

As of 5/31/24. Sources: Bloomberg, Wellington Management.

FIGURE 8

Fixed-Income Spreads (bps)

As of 5/31/24. Past performance does not guarantee future results. US IG Corp is represented by the Bloomberg US Corporate Bond Index; US HY Corp is represented by the Bloomberg US Corporate High Yield Bond Index; EMD is represented by the J.P. Morgan EMBI Global Diversified Index; MBS is represented by the Bloomberg US MBS Index; Bank Loans are represented by the Morningstar/LSTA US Leveraged Loan Index. See below for representative index definitions. Sources: Bloomberg, JP Morgan, Morningstar LSTA, and Wellington Management.


To learn more about opportunities in fixed income, please talk to your financial representative.


1 An r-star example: If the r-star/neutral rate for an economy is 1% but the real policy rate set by the central bank is 2%, monetary policy is said to be restrictive. But it's not easy to know what r-star actually is; it's not possible to directly observe, and it's usually a modeled output. Some critics would say it's, at best, a moving target with large errors. So, if it was later determined that r-star was closer to 2%, then monetary policy would be deemed less restrictive than expected. The challenge is that the error is only known after the fact.

2 The Federal Open Market Committee (FOMC) is the division of the Federal Reserve that sets monetary policy by managing open-market operations. By doing this, the Fed influences the fed funds rate, which impacts other interest rates.

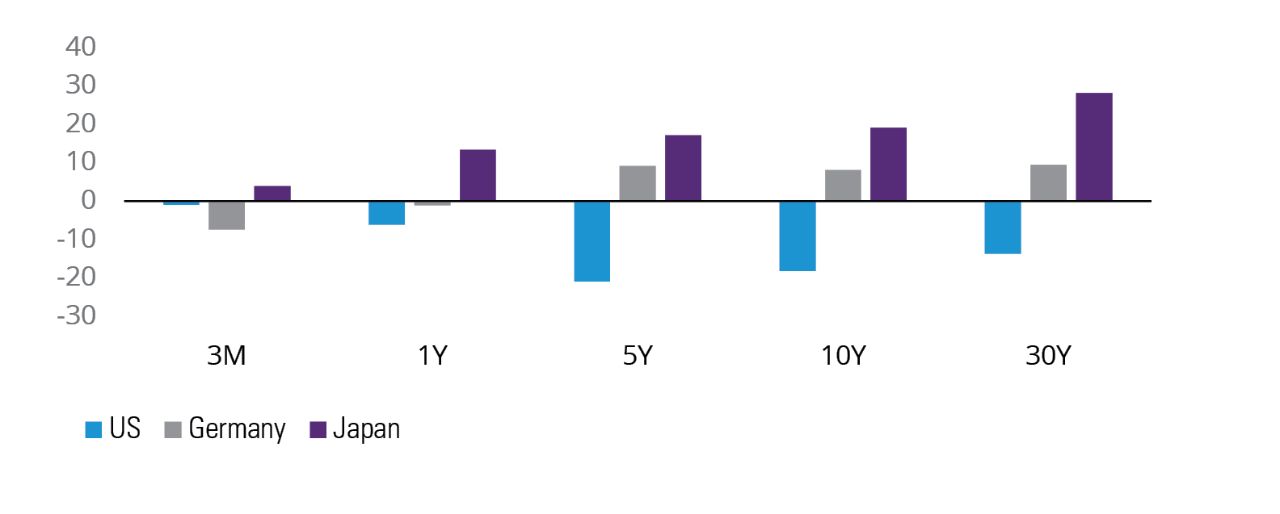
3 Sovereign bond yield is the interest rate paid to the buyer of the bond by the government, or sovereign entity, issuing that debt instrument. Sovereign bonds are issued by governments to raise capital and are considered risk-free assets.

4 A basis point (bps) is a unit that is equal to 1/100th of 1%, and is used to denote the change in a financial instrument. The basis point is commonly used for calculating changes in interest rates, equity indexes and the yield of a fixed-income security.

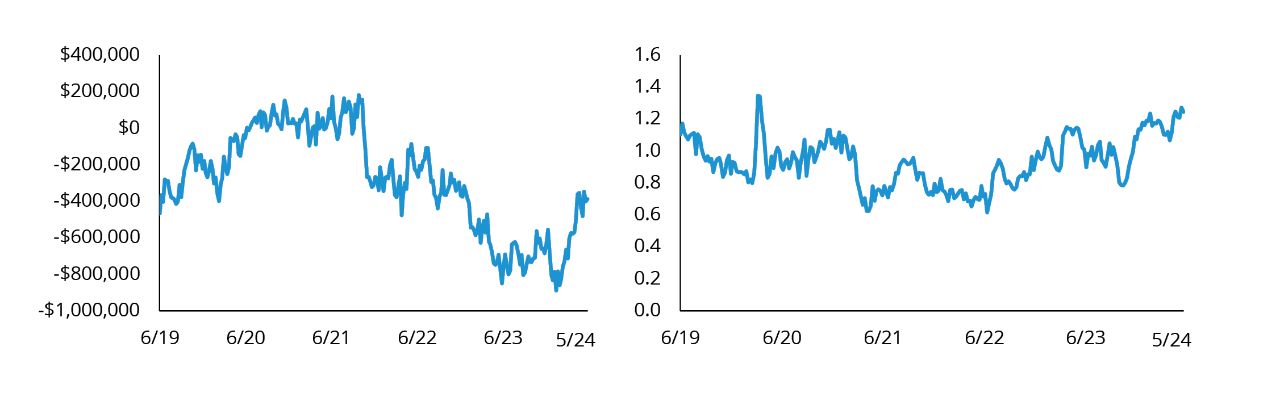
5 A short, or a short position, is created when a trader sells a security first with the intention of repurchasing it or covering it later at a lower price. A trader may decide to short a security when they believe that the price of that security is likely to decrease in the near future.

6 A Treasury auction tail is the difference between the highest yield accepted at auction and the security's when-issued yield before the auction ends. The when-issued yield is the yield on a Treasury determined through forward trading between the announcement of an auction and the issuance of securities.

7 The yield curve is a line that plots interest rates of bonds having equal credit quality but differing maturity dates; its slope is used to forecast the state of the economy and interest-rate changes.

8 Duration is a measure of the sensitivity of an investment’s price to nominal interest-rate movement.

9 Unlike US presidential election dates that are known well in advance, the UK Prime Minister selects the timing of British elections, which are held every five years.

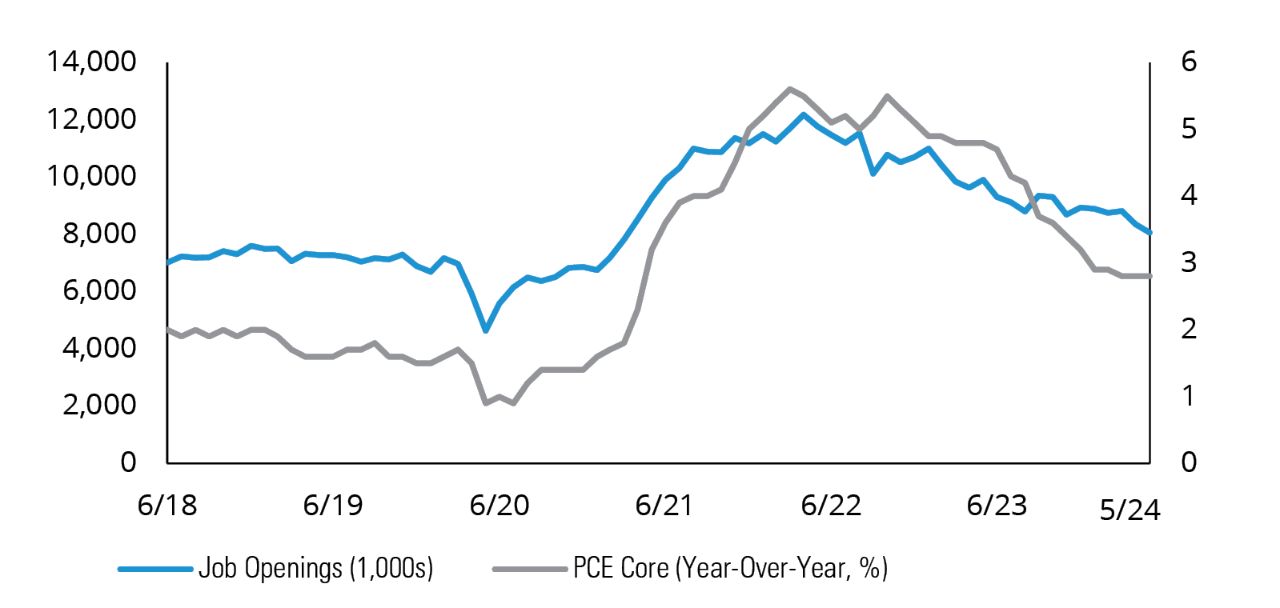
10 The Job Openings and Labor Turnover Survey (JOLTS) program produces data on job openings, hires, and separations.

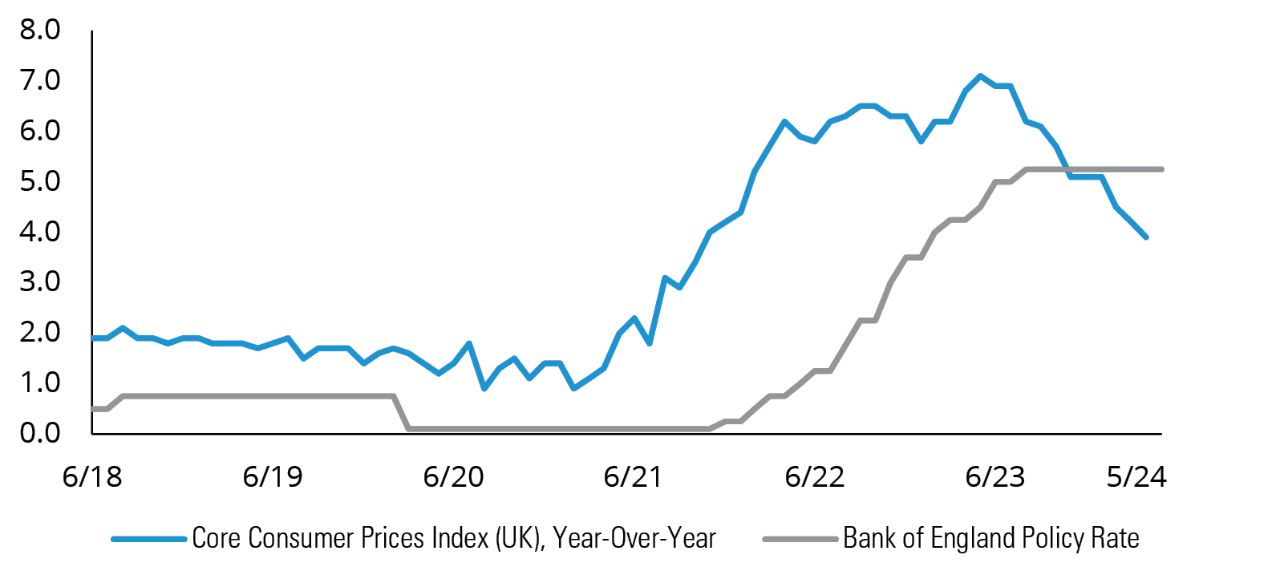
11 The Consumer Price Index (CPI) is a measure of change in consumer prices as determined by the US Bureau of Labor Statistics. Personal consumption expenditures (PCE) is a measure of the spending on goods and services by people in the US as determined by the US Bureau of Economic Analysis.

12 Go-anywhere strategies are typically benchmark-agnostic and not bound by limits on exposure by sector, quality, currency, or country. Whereas traditional core-bond-plus strategies generally have flexibility to invest across the fixed-income landscape, they generally have upper limits on the amount that can be invested in securities rated below-investment-grade, domiciled outside the US, non-US-dollar-denominated, or reside in a particular sector (e.g., emerging markets).

13 Core/core plus strategies typically invest in a baseline of investment-grade bonds such as government, corporate, and securitized debt. Core-plus funds can take that baseline and add additional sectors such as corporate high-yield, emerging-market debt, or non-US currency exposures to enhance returns.

14 Convexity is the relationship between bond prices and bond yields.

15 Securitized credit involves pooling a large number of loans into an investable asset. Examples include mortgage-backed or asset-backed securities.

16 High-yield (HY) securities, or "junk bonds," are rated below-investment-grade because there is a greater possibility that the issuer may be unable to make interest and principal payments on those securities.

17 Carry is the difference between the yield on a longer-maturity bond and the cost of borrowing.

18 A senior bank loan is a debt financing obligation issued to a company by a bank or similar financial institution and then repackaged and sold to investors. The repackaged debt obligation consists of multiple loans. Senior bank loans hold legal claim to the borrower's assets above all other debt obligations.

19 Emerging-market debt (EMD) are debt instruments issued by developing countries. These bonds tend to offer higher yields than Treasuries or corporate bonds in the US. Emerging-market issues tend to carry higher risks than domestic debt instruments.

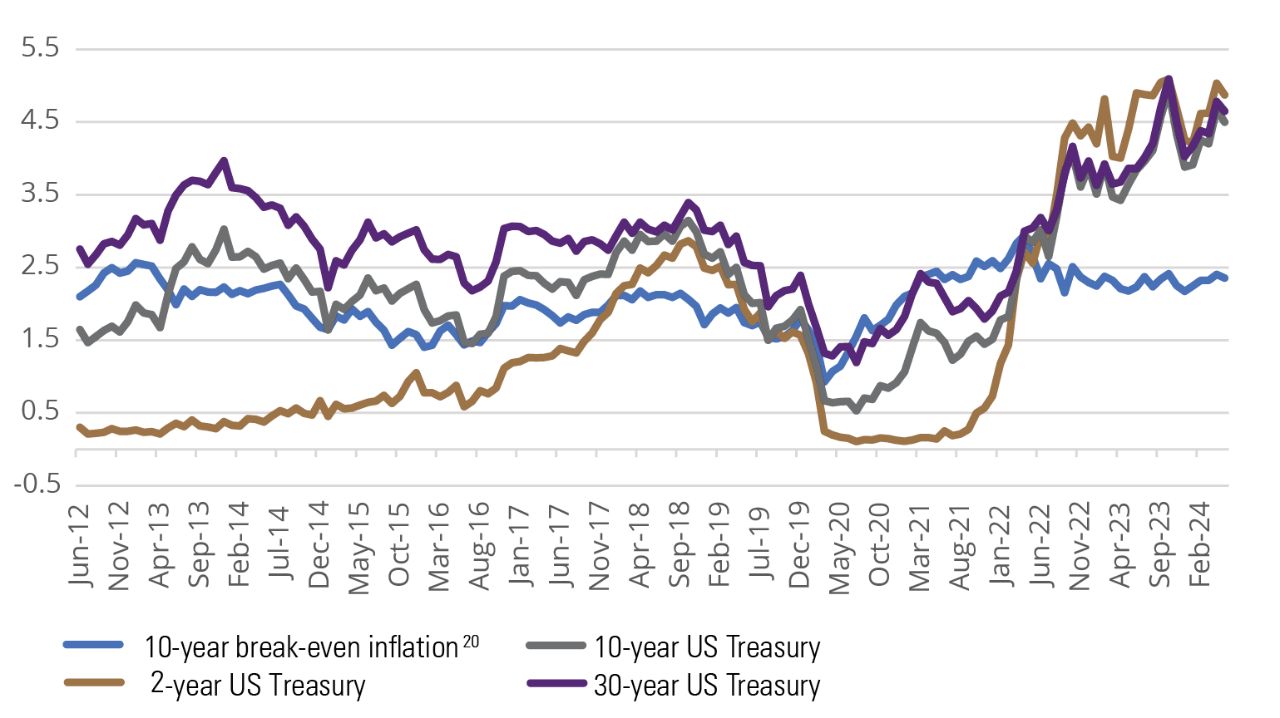
20 The break-even inflation rate is a measurement that aims to predict the effects of inflation on certain investments, by analyzing known market inflation rates from recent years. It can be calculated by comparing the yield of an inflation-based bond (such as Treasury Inflation-Protected Securities, or TIPS) with a nominal bond of the same maturity period. The difference represents the break-even inflation rate, or the rate that inflation would have to be for an investor to “break even”—or earn the same return—between purchasing TIPS or nominal Treasuries.


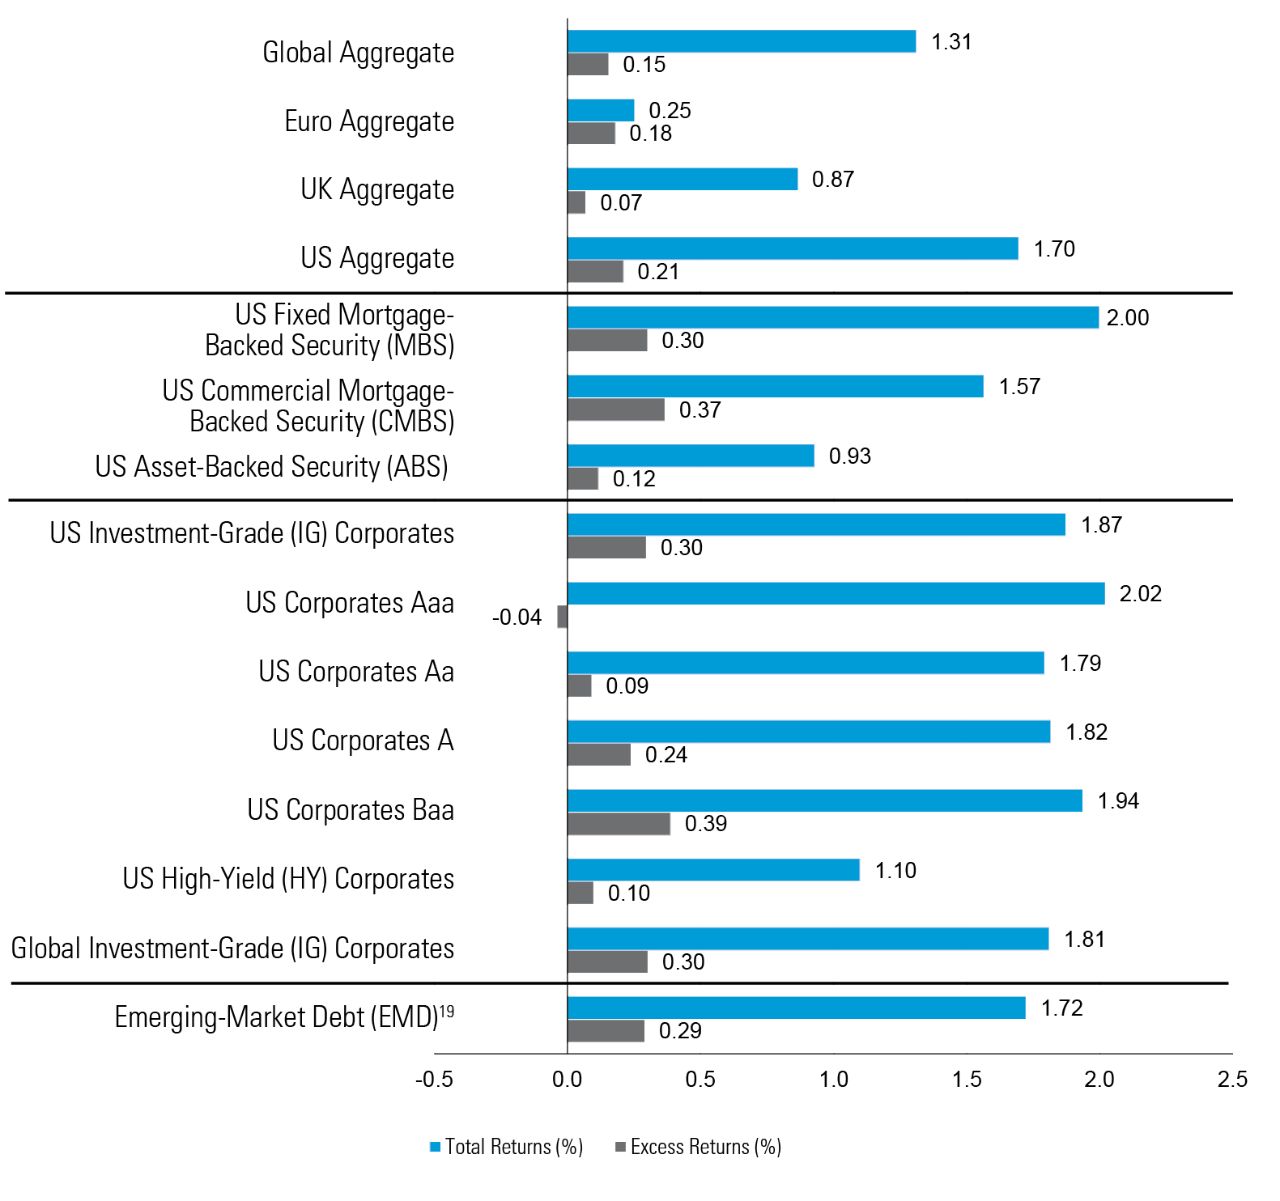
Representative Indices from Figure 6:

Global Aggregate: Bloomberg Global Aggregate Bond Index; Euro Aggregate: Bloomberg Global Aggregate Bond Index - European Euro; UK Aggregate: Bloomberg Global Aggregate Bond Index - United Kingdom; US Aggregate: Bloomberg US Aggregate Bond Index; US Fixed MBS: Bloomberg US MBS Index; US CMBS: Bloomberg CMBS ERISA Eligible Index; US ABS: Bloomberg Asset-Backed Securities Index; US IG Corporates: Bloomberg US Corporate Bond Index; US Corporates Aaa: Bloomberg Aaa Corporate Bond Index; US Corporates Aa: Bloomberg Aa Corporate Bond Index; US Corporates A: Bloomberg A Corporate Index; US Corporates Baa: Bloomberg Baa Corporate Bond Index; US High-Yield Corporates: Bloomberg US Corporate High Yield Bond Index; Global IG Corporates: Bloomberg Global Credit - Corporate Bond Index; Emerging-Markets Debt: Bloomberg Emerging Markets Hard Currency Bond Index.


Index Definitions:

Bloomberg Global Aggregate Index is a broad-based measure of the global investment-grade fixed-rate debt markets. Bloomberg Global Aggregate Bond Index - European Euro includes fixed-rate, investment-grade Euro denominated bonds. Bloomberg Global Aggregate Bond Index - United Kingdom includes fixed-rate, investment-grade sterling-denominated bonds. Bloomberg US Aggregate Bond Index is composed of securities from the Bloomberg Government/Credit Bond Index, Mortgage-Backed Securities Index, Asset-Backed Securities Index, and Commercial Mortgage-Backed Securities Index. Bloomberg US MBS Index tracks fixed-rate agency mortgage backed passthrough securities guaranteed by Ginnie Mae (GNMA), Fannie Mae (FNMA), and Freddie Mac (FHLMC). Bloomberg CMBS ERISA Eligible Bond Index measures the performance of investment-grade commercial mortgage-backed securities, which are classes of securities that represent interests in pools of commercial mortgages. The index includes only CMBS that are Employee Retirement Income Security Act of 1974. Bloomberg Asset-Backed Securities Index, the ABS component of the Bloomberg US Aggregate Index, has three subsectors: credit and charge cards, autos, and utility. Bloomberg US Corporate Bond Index covers all publicly issued, fixed rate, nonconvertible, investment-grade debt. Bloomberg Aaa Corporate Bond Index is designed to measure the performance of investment-grade corporate bonds that have a credit rating of Aaa. Bloomberg Aa Corporate Bond Index is designed to measure the performance of investment-grade corporate bonds that have a credit rating of Aa. Bloomberg A Corporate Bond Index is designed to measure the performance of investment-grade corporate bonds that have a credit rating of A. Bloomberg Baa Corporate Bond Index is designed to measure the performance of investment-grade corporate bonds that have a credit rating of Baa. Bloomberg US Corporate High Yield Bond Index is an unmanaged broad-based market-value-weighted index that tracks the total return performance of non-investment grade, fixed-rate, publicly placed, dollar denominated and nonconvertible debt registered with the Securities and Exchange Commission. Bloomberg Global Credit - Corporate Bond Index is an unmanaged index considered representative of fixed rate, non-investment grade debt of companies in the US, developed markets, and emerging markets. Bloomberg Emerging Markets Hard Currency Bond Index includes USD-denominated debt from sovereign, quasi-sovereign, and corporate EM issuers. Morningstar/LSTA Leveraged Loan Index is a market-value-weighted index that is designed to measure the performance of the US leveraged loan market based upon market weightings, spreads, and interest payments. J.P. Morgan EMBI Global Diversified Index is a broad-based, unmanaged index which tracks liquid, US Dollar emerging-market fixed- and floating-rate debt instruments issued by sovereign and quasi-sovereign entities. 

Important Risks: Investing involves risk, including the possible loss of principal. • Fixed income security risks include credit, liquidity, call, duration, and interest-rate risk. As interest rates rise, bond prices generally fall. • Investments in high-yield (“junk”) bonds involve greater risk of price volatility, illiquidity, and default than higher-rated debt securities. • Mortgage-related and asset-backed securities’ risks include credit, interest-rate, prepayment, and extension risk. The value of the underlying real estate of real estate related securities may go down due to various factors, including but not limited to strength of the economy, amount of new construction, laws and regulations, costs of real estate, availability of mortgages, and changes in interest rates. • Loans can be difficult to value and less liquid than other types of debt instruments; they are also subject to nonpayment, collateral, bankruptcy, default, extension, prepayment and insolvency risks. • Foreign investments may be more volatile and less liquid than US investments and are subject to the risk of currency fluctuations and adverse political, economic and regulatory developments. These risks may be greater, and include additional risks, for investments in emerging markets. 

The views expressed herein are those of Wellington Management, are for informational purposes only, and are subject to change based on prevailing market, economic, and other conditions. The views expressed may not reflect the opinions of Hartford Funds or any other sub-adviser to our funds. They should not be construed as research or investment advice nor should they be considered an offer or solicitation to buy or sell any security. This information is current at the time of writing and may not be reproduced or distributed in whole or in part, for any purpose, without the express written consent of Wellington Management or Hartford Funds.


FIOWP021 3645658
Insight from sub-adviser Wellington Management
Author Headshot
Managing Director at Wellington Management LLP and Fixed-Income Strategist for Hartford Funds


The material on this site is for informational and educational purposes only. The material should not be considered tax or legal advice and is not to be relied on as a forecast. The material is also not a recommendation or advice regarding any particular security, strategy or product. Hartford Funds does not represent that any products or strategies discussed are appropriate for any particular investor so investors should seek their own professional advice before investing. Hartford Funds does not serve as a fiduciary. Content is current as of the publication date or date indicated, and may be superseded by subsequent market and economic conditions.

Investing involves risk, including the possible loss of principal. Investors should carefully consider a fund's investment objectives, risks, charges and expenses. This and other important information is contained in the mutual fund, or ETF summary prospectus and/or prospectus, which can be obtained from a financial professional and should be read carefully before investing.

Mutual funds are distributed by Hartford Funds Distributors, LLC (HFD), Member FINRA|SIPC. ETFs are distributed by ALPS Distributors, Inc. (ALPS). Advisory services may be provided by Hartford Funds Management Company, LLC (HFMC) or its wholly owned subsidiary, Lattice Strategies LLC (Lattice). Certain funds are sub-advised by Wellington Management Company LLP and/or Schroder Investment Management North America Inc (SIMNA). Schroder Investment Management North America Ltd. (SIMNA Ltd) serves as a secondary sub-adviser to certain funds. HFMC, Lattice, Wellington Management, SIMNA, and SIMNA Ltd. are all SEC registered investment advisers. Hartford Funds refers to HFD, Lattice, and HFMC, which are not affiliated with any sub-adviser or ALPS. The funds and other products referred to on this Site may be offered and sold only to persons in the United States and its territories.

© Copyright 2024 Hartford Funds Management Group, Inc. All Rights Reserved. Not FDIC Insured | No Bank Guarantee | May Lose Value