Pre-Sales Support
Mutual Funds and ETFs - 800-456-7526
Monday-Thursday: 8:00 a.m. – 6:00 p.m. ET
Friday: 8:00 a.m. – 5:00 p.m. ET
Post-Sales and Website Support
888-843-7824
Monday-Friday: 9:00 a.m. - 6:00 p.m. ET
After weeks of speculation, President Joe Biden announced that he would withdraw from this year’s presidential race and endorsed Vice President Kamala Harris as the Democratic nominee. While her nomination as the official candidate is not yet final, the cards are stacked in her favor, and she appears to be the most likely nominee based on betting odds.
FIGURE 1
Betting Odds: Democratic Presidential Nominee
(% Probability)
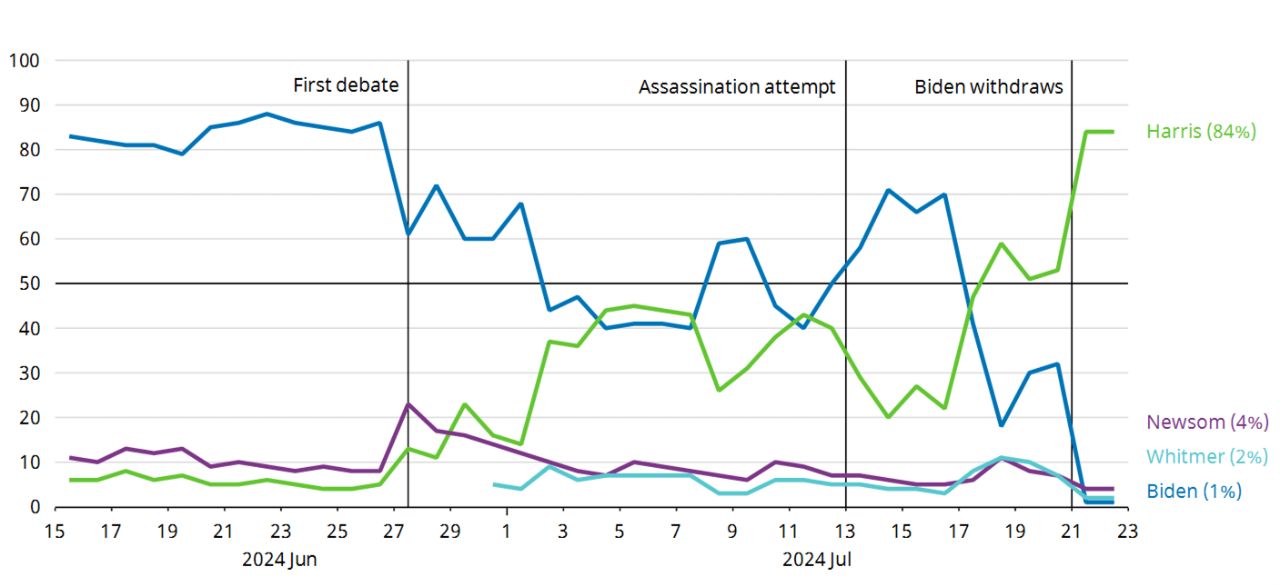
As of 7/22/24. Data Sources: Schroders Economics Group, PredictIt, and Macrobond, 7/24.
Attention is now turning to Harris’ potential running mate: Governors of battleground states and deep red states are among the most likely candidates. While the odds of Democrats retaining the White House have improved slightly, Harris has a clean slate to change the narrative around the election.
FIGURE 2
Betting Odds: Winning Party in US Presidential Election
(% Probability)
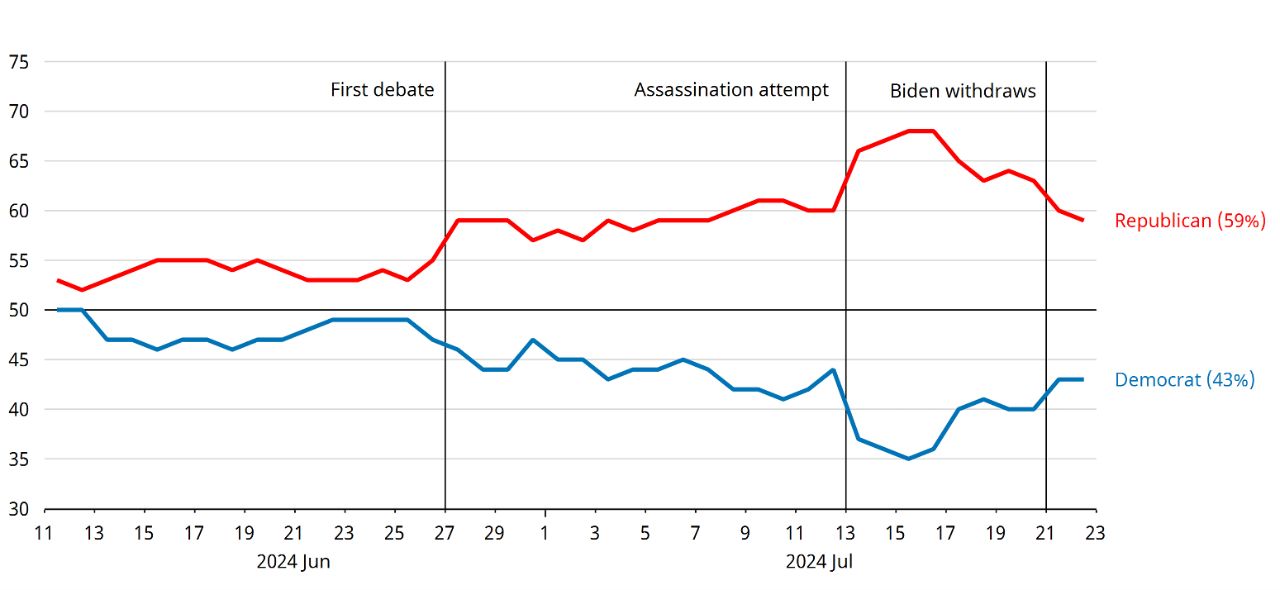
As of 7/22/24. Data Sources: Schroders Economics Group, PredictIt, RealClearPolitics, and Macrobond, 7/24.
In terms of market reaction, yield curves1 have steepened over recent weeks as expectations of a victory for former President Trump rose. This was because a Republican “clean sweep” would allow Trump a freer hand on fiscal stimulus. By contrast, a Democratic president would face a divided government. It may, therefore, be that the recent steepening of yield curves could reverse if Harris, or another Democratic candidate, narrows the gap in the polls.
The recent assassination attempt has given Trump’s campaign considerable momentum that could carry him through to the November election.
Nonetheless, Trump still appears to be more likely to win as of now. The recent assassination attempt has given his campaign considerable momentum that could carry him through to the November election. Given Trump’s lead in the polls, we set out our key economic expectations if there were to be a Trump victory.
Trump’s Economic Agenda Remains Firmly Neo-Mercantilist
If Trump is re-elected president, his agenda will be partly dictated by how Congress shapes up. In the Senate, the Democrats face a near impossible task of retaining their slim 51-49 majority this year. Two-thirds of the 34 seats being contested are held by the Democratic caucus. Three of these look particularly vulnerable: West Virginia, following Sen. Joe Manchin’s (I-WV) decision to not seek re-election, as well as Ohio and Montana—states which Trump carried comfortably in the previous two presidential elections. As a result, Republicans seem to be well positioned to regain control of the Senate.
However, the House of Representatives is a more open contest. All 435 seats are contested every two years, and the Democrats, now in the minority, only need to pick up five additional seats to shift the balance of power. Here, partisan divisions surrounding abortion could prove pivotal, much like they did in the 2022 midterms. But presidential elections tend to have an impact on down-ballot races through a “coat-tail effect.” If Trump returns to the White House, he stands a reasonable chance doing so with an ideologically aligned Congress, while also benefitting from the conservative majority in the Supreme Court that he helped appoint.
FIGURE 3
Senate Arithmetic Favors Republicans
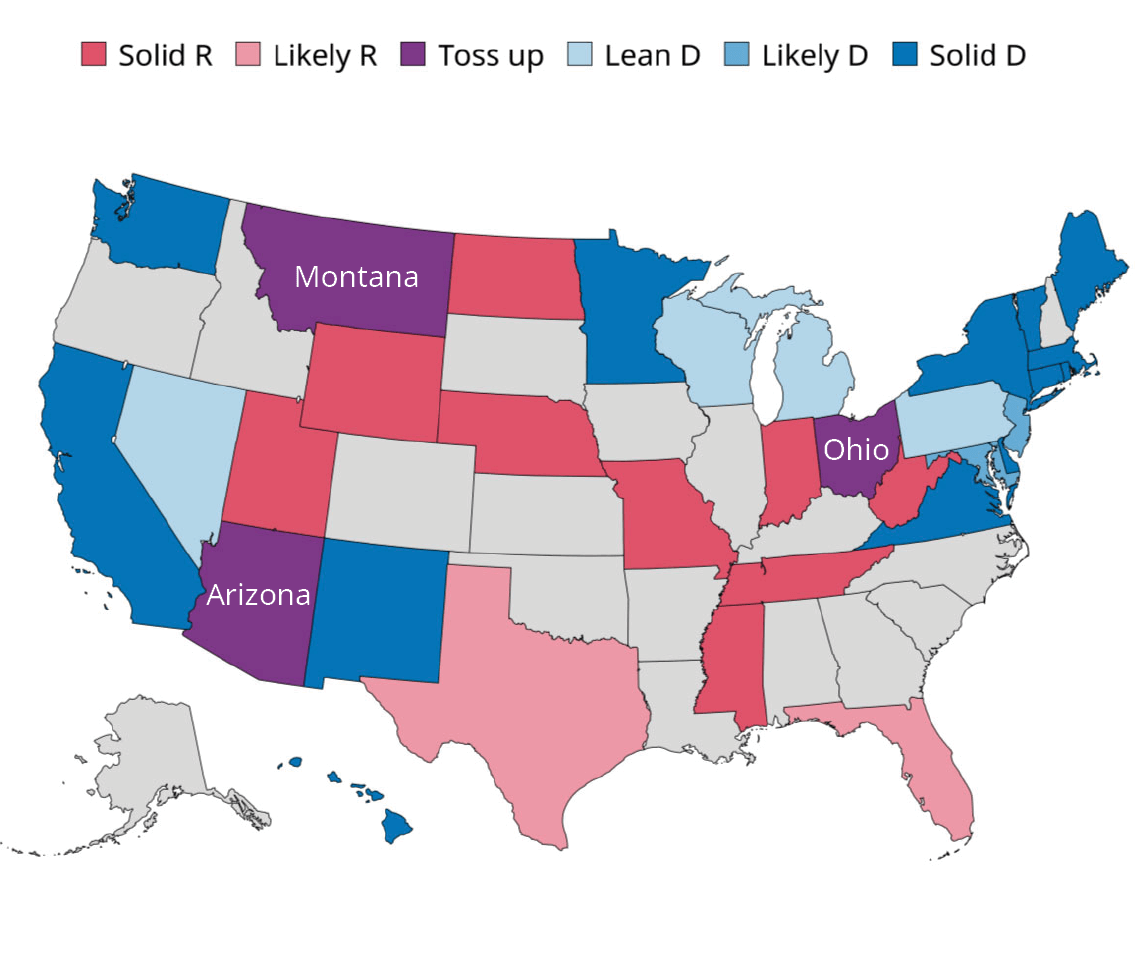
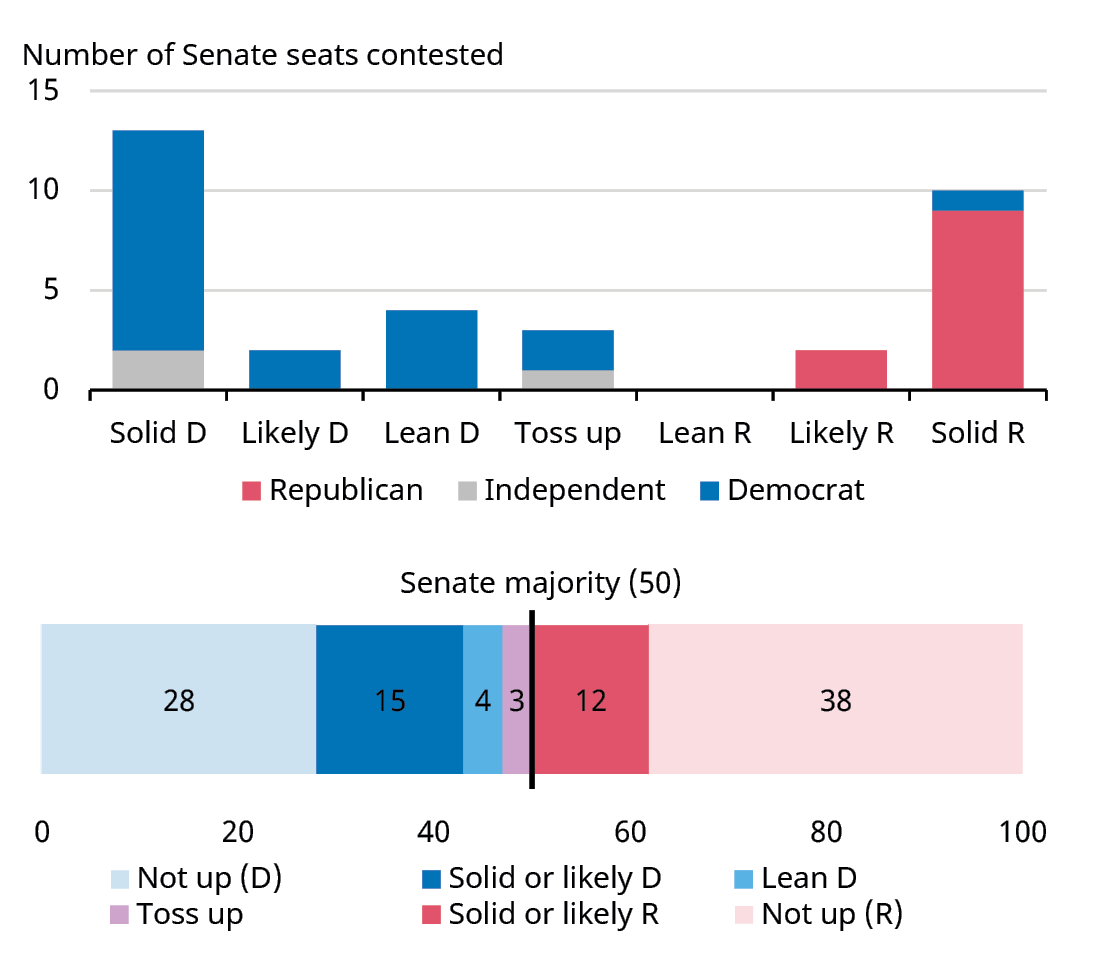
As of 7/22/24. Data Sources: Schroders Economics Group and 270toWin, 7/24.
Still, Trump doesn’t need support from Congress for the central plank of his economic agenda: protectionism. As president, he cited national security concerns as the basis for raising tariffs, and used the power granted to presidents under Section 232 of the US trade laws. Beijing was the most common target, with the average tariff levied on imports from China climbing from 3% to nearly 20% during his term. If re-elected, Trump has proposed to hike this to 60%, as well as phasing out all imports of essential goods from China. In addition to this, imports from the rest of the world would be subjected to a 10% baseline tariff.
If implemented, these proposals would present a significant inflationary shock. However, we suspect Trump doesn’t intend to fully follow through with these proposals, but would instead leverage them in a targeted manner to extract trade concessions. During Trump’s 2016 term, his administration gradually ratcheted up tariffs, starting with industrial goods that would have little direct impact on consumer inflation. It was a relatively unconventional approach, but ultimately a successful one as it resulted in the “phase one” deal with China, as well as a re-negotiation of the North American Free Trade Agreement.
Assuming we’re correct and Trump sticks to the same playbook, three factors could help to blunt the inflationary impact of tariffs. First, the US dollar would likely appreciate, especially against the Chinese Yuan, as Beijing would probably pursue a devaluation in this scenario. Second, the widening in corporate profit margins since the COVID-19 pandemic could serve to absorb higher import costs. Finally, goods might be routed via countries that are on more favorable trade terms with the US, as China appears to have done since the start of the trade war (FIGURE 4).
FIGURE 4
US-China Trade War Had Little Inflationary Impact, Partly Due To Re-Routing
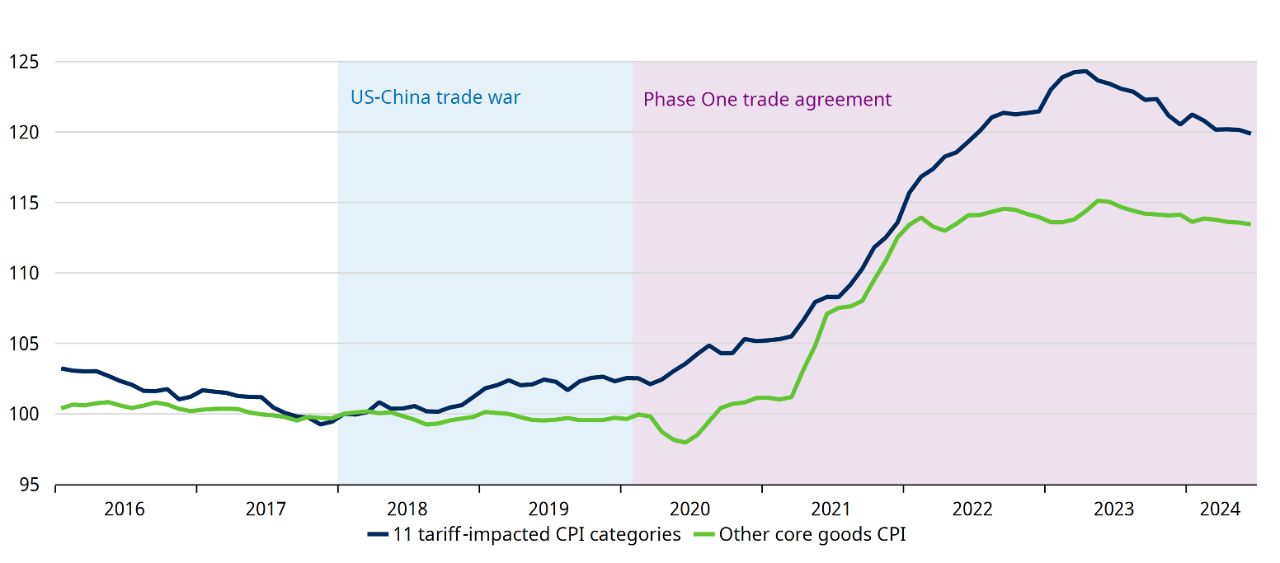
As of 7/22/24. Past performance does not guarantee future results. Indices are unmanaged and not available for direct investment. Note: 11 tariff-impacted Consumer Price Index categories include laundry equipment, other appliances, furniture and bedding, floor coverings, motor-vehicle parts and equipment, sports vehicles (including bicycles), housekeeping supplies, sewing equipment and supplies, home décor, outdoor equipment and supplies, and dishes and flatware. The Consumer Price Index (CPI) is a measure of change in consumer prices as determined by the US Bureau of Labor Statistics. For illustrative purposes only. Data Sources: Schroders Economics Group, Bureau of Labor Statistics, and Macrobond, 7/24.
However, Trump’s immigration plans could be more challenging to circumvent. He has pledged to deport 15 million undocumented individuals and suggested this might be modelled on Eisenhower’s 1954 deportation initiative along the border with Mexico. Whether this is ultimately realized remains to be seen; Trump similarly promised to deport 11 million people during his first term but failed to deliver. Still, his administration did manage to cut annual net inward migration from 650,000 to 200,000 by enacting some 472 administrative changes.
Another immigration clampdown could be more disruptive this time around. Job growth in recent years has been almost entirely driven by foreign-born workers, with the native-born labor force having stagnated. Lower immigration is, therefore, likely to exacerbate worker scarcity, particularly in sectors heavily reliant on foreign labor such as agriculture and construction. This could then lead to a resurgence in wage growth that further stokes inflationary pressures, especially as the drag on the labor force would also weigh on potential GDP growth.
FIGURE 5
Immigration Clampdown Could Be the Bigger Economic Challenge
Change Since January 2020 (Millions)
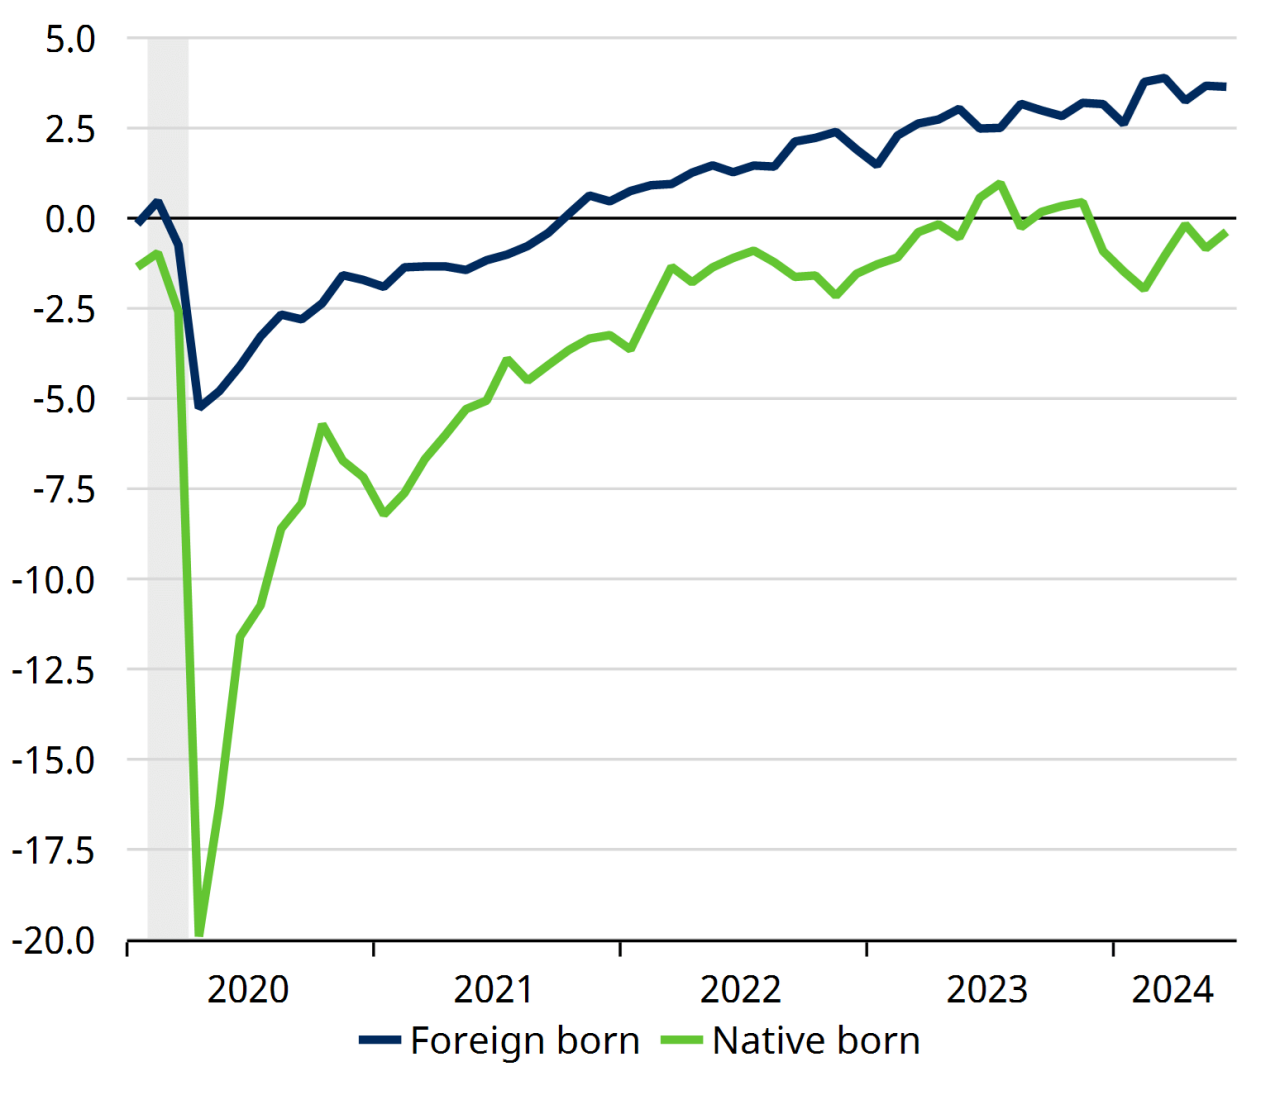
Thousands (Seasonally Adjusted)
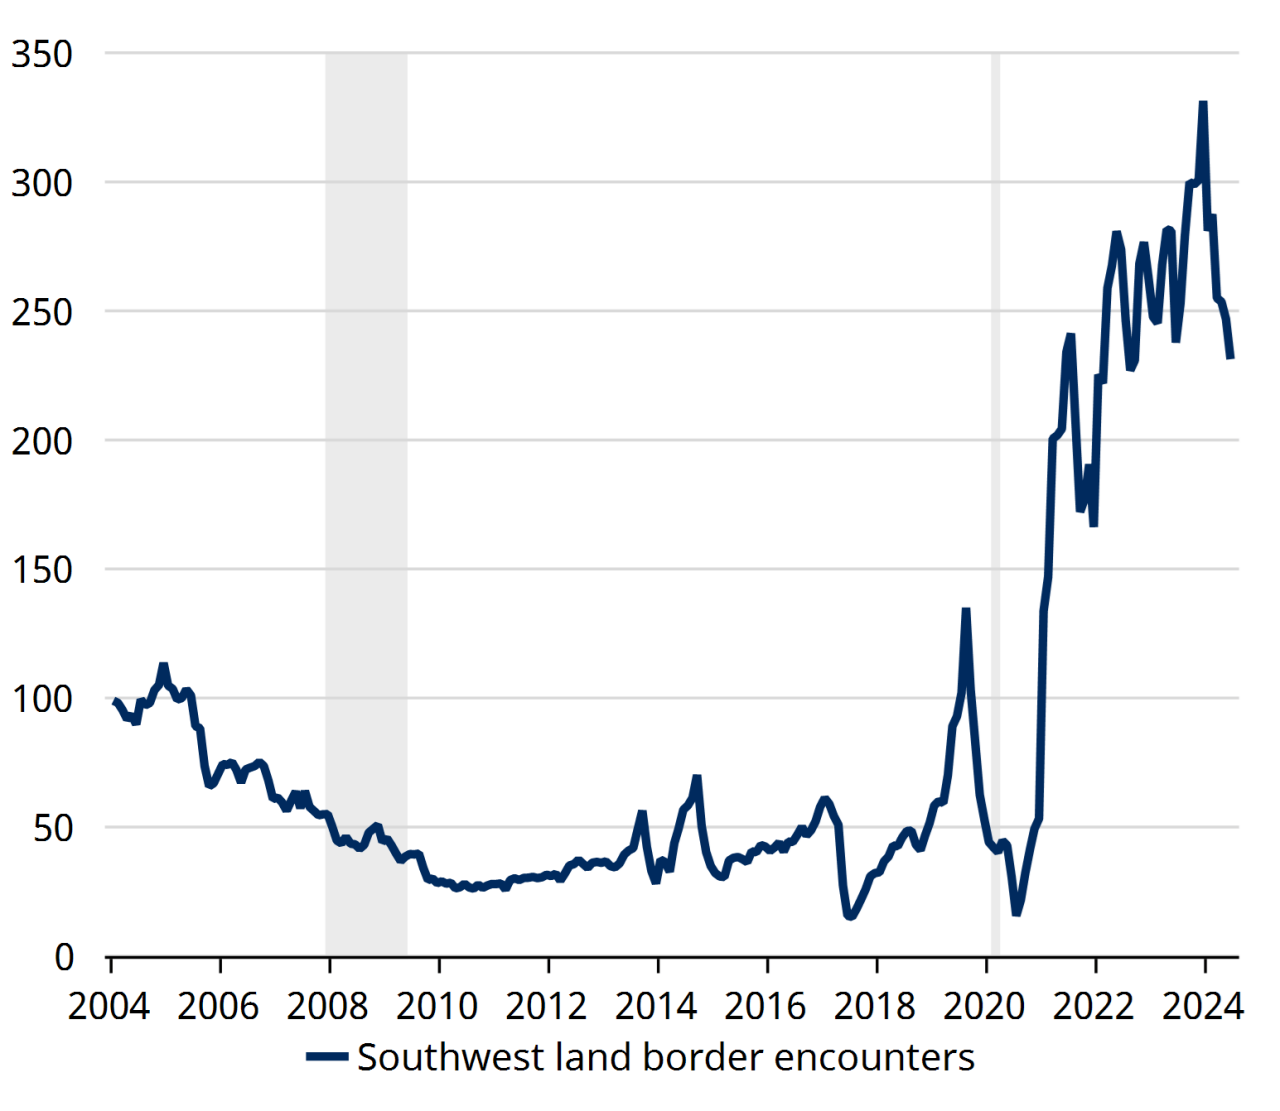
As of 7/22/24. Data Sources: Schroders Economics Group, Bureau of Labor Statistics, Dallas Fed, Customs and Border Protection, and Macrobond, 7/24.
In isolation, higher inflation and lower job creation would act as a headwind to the economy. But our expectation is that this could be more than offset by various growth promoting policies. Of these, the biggest will be Trump’s promise to extend the provisions from his 2017 Tax Cuts and Jobs Act (TCJA), which are due to expire next year. Trump has also said that he would cut the corporate tax rate to 20% or possibly as low as 15%, having reduced it from 35% to 21% when he was in the White House.
Implementing these measures will require the consent of Congress. Fiscal hawks on the Republican side might balk at the cost; such measures would cost around $5 trillion over the next 10 years—more than 15% of GDP—at a time when the national debt now stands at 123% of GDP. But we suspect this would be partially offset by the repeal of certain climate-related provisions of the Inflation Reduction Act and cuts to federal Social Security benefits, as well as the revenue raised from higher tariffs.
Growth could also be supported by Trump’s deregulatory agenda. One of the biggest beneficiaries would be the energy sector. Trump has pledged to end delays in federal drilling permits and leases, remove limits on natural gas exports, and roll back car emissions rules set to come into force in 2032. But a broader deregulatory push might be mounted after the Supreme Court overturned the 1984 “Chevron deference,” weakening the power of federal regulatory agencies. For instance, Trump is reportedly planning to further cut red tape for banks, which could spur credit growth.
FIGURE 6
Extending the Expiring 2017 Tax Cuts Won’t Be Cheap
Impact on the Budget Deficit 2025-2034 ($ Billions)
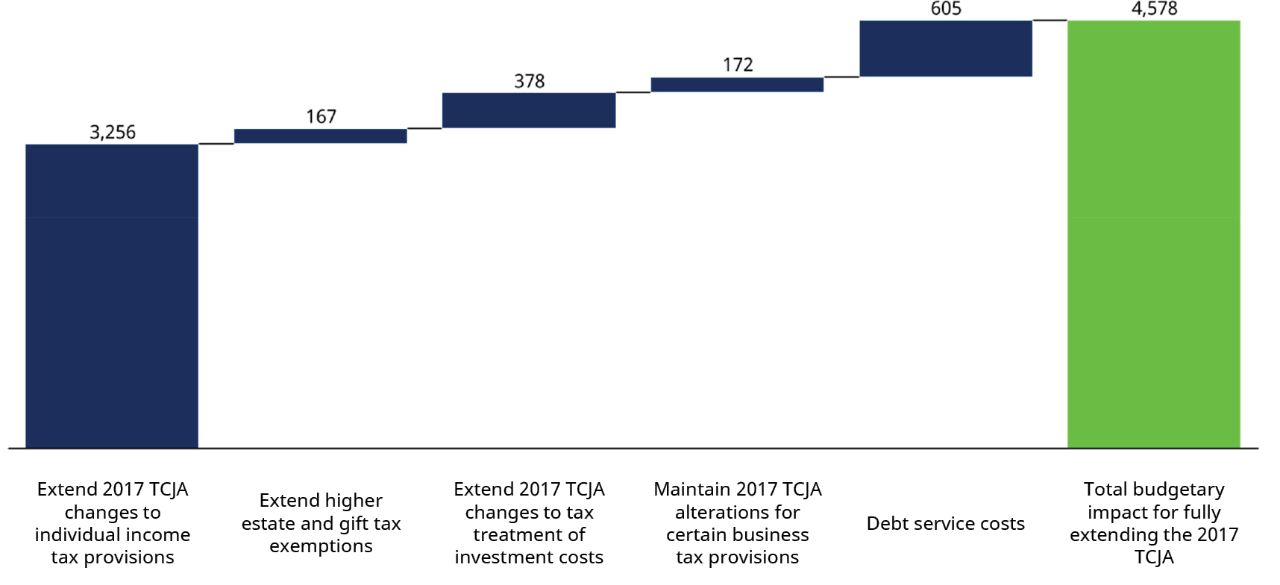
As of 7/22/24. For illustrative purposes only. Data Sources: Schroders Economics Group, and the Congressional Budget Office, 7/24.
If Trump were to win the election, our expectation is that US growth would be stronger and inflation firmer.
Trumponomics 2.0 Could Push the US in a Reflationary Direction
If Trump were to win the election, our expectation is that US growth would be stronger and inflation firmer. This appears to be in line with the market consensus, with the yield curve steepening after both the first debate and the assassination attempt, which were perceived to boost Trump’s odds of victory. But quantifying the precise economic impact is especially challenging. Not only because the Trump campaign has been light on detail, but also given Trump’s history of being overambitious in his policy promises and his pattern of unpredictable decision-making.
As such, this has meant that we’ve had to make several wide-ranging, substantial assumptions about a second Trump presidency, some of which may very well be proven wrong. However, one thing that we’re confident about is that most of the macroeconomic impact won’t be felt until 2026 at the earliest. Not only will it take time to legislate and implement his agenda, but the lags associated with the policy transmission mechanism will also contribute to this delay before eventually feeding through to activity and prices.
In terms of growth, our analysis suggests the US economy could expand by 2.2% in 2025 under a second Trump presidency. It could then accelerate to 2.7% in 2026 as the administration’s growth-promoting policies kick in, before easing back to 2.3% in 2027 as higher inflation weighs on consumer spending.
On that topic, we expect an easing in core CPI inflation to 2.6% next year will prove short-lived. Our projections suggest it could rebound to above 3% in both 2026 and 2027 as the incremental increases in tariffs and wage costs are passed on to consumers.
A Trump victory may be more reflationary than if a Democratic candidate were to be elected.
As such, a Trump victory may be more reflationary than if a Democratic candidate were to be elected. Our expectation is that a Democratic president’s policy agenda could be hamstrung for the first two years of their term due to a possible Senate flip that would leave Republicans in charge. In any event, we expect the economy to revert to trend in the coming years under a Democratic president.
FIGURE 7
Trump’s Policy Proposals Could Lift Growth, But Also Inflation
GDP Growth (%)
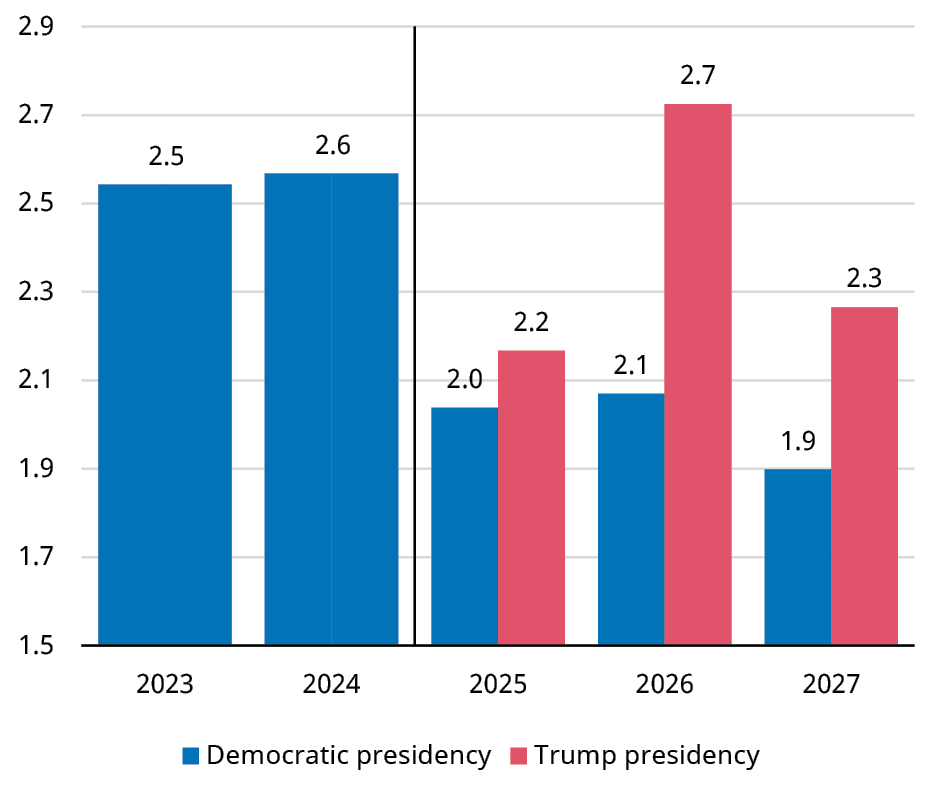
Core CPI Inflation (% year over year)
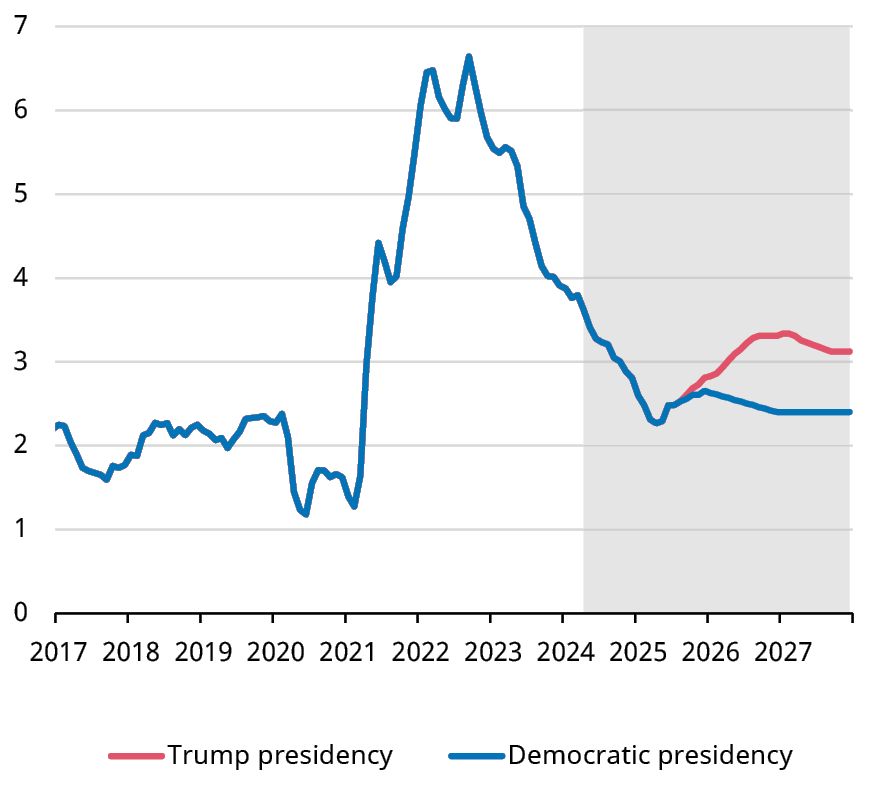
As of 7/22/24. Past performance does not guarantee future results. Indices are unmanaged and not available for direct investment. For illustrative purposes only. Data Sources: Schroders Economics Group, Bureau of Economic Analysis, Bureau of Labor Statistics, and LSEG DataStream, 7/24.
Rates Could Be More Restrictive Under Trump, At Least Initially
It’s no secret that Trump isn’t a fan of Federal Reserve (Fed) Chair Jerome Powell, so it came as little surprise when he confirmed that he wouldn’t nominate him for a third term if re-elected president. Despite this, he has recently clarified that he wouldn’t seek to remove the Fed Chair before the end of his second term, which runs until May 2026, following speculation that he might.
Still, we continue to believe that Powell’s reign at the helm could be short-lived if Trump ascends to the presidency once again. Powell could become a convenient scapegoat if the economy suffers any setbacks. Good economic news might not be able to extend his time at the Fed given that the president and his administration could, perhaps justifiably, take credit for delivering the policies that led to those positive developments.
If Trump were to return to the White House, our expectation is that the Fed will enact a mid-cycle adjustment of 75 basis points by early 2025.
At the same time, Powell has stated that he plans to see out the entirety of his second term. And so if Trump were to return to the White House, our expectation is that the Fed will enact a mid-cycle adjustment of 75 basis points2 by early 2025. But we would subsequently expect rates to remain on hold under Powell’s stewardship as Trump’s tariff and immigration policies then stoke inflationary pressures.
If Harris, or another Democratic candidate, were to be elected, we expect some further modest easing in 2026 as the Fed looks to revert to a less restrictive stance for monetary policy.
FIGURE 8
Tariffs and Lower Immigration Could Limit Scope for Fed Rate Cuts Under Powell
Upper Limit of the Federal Funds Target Range (%)
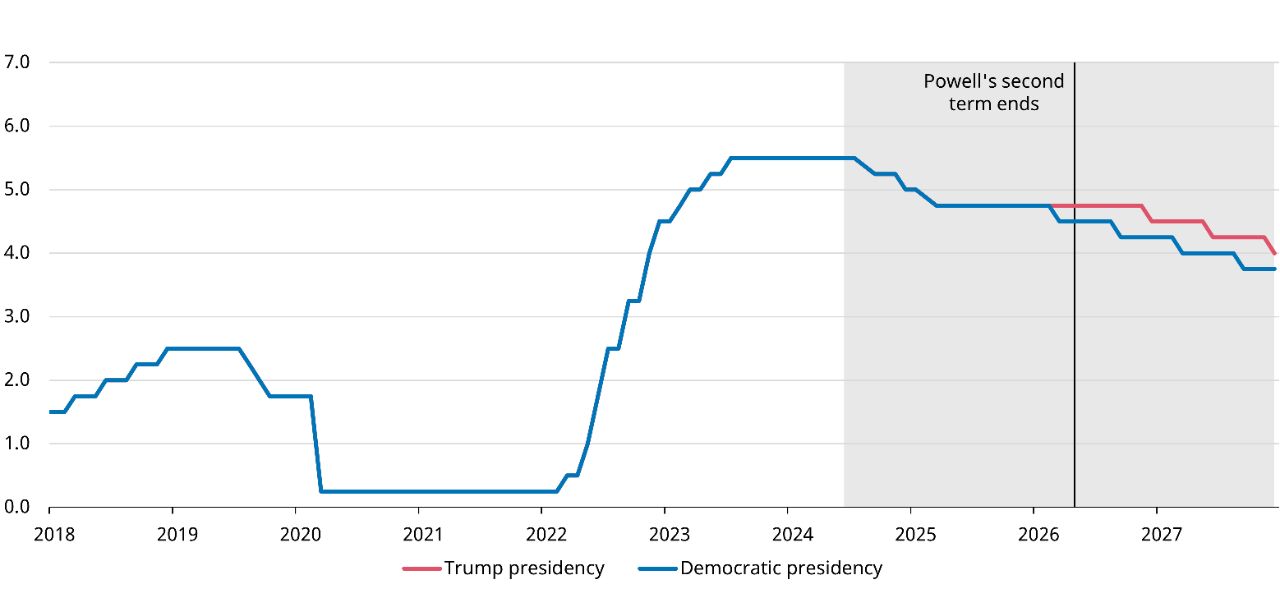
As of 7/22/24. Shaded area represents projections from Schroders. The federal funds rate is the target interest rate set by the Federal Open Market Committee. This target is the rate at which commercial banks borrow and lend their excess reserves to each other overnight. For illustrative purposes only. Data Sources: Schroders Economics Group, Federal Reserve, and LSEG Datastream, 7/24.
After Powell’s term ends in May 2026, however, Trump would push to replace him with a more dovish Fed Chair. He would still need to select a mainstream economist because his nominee will have to be confirmed by the Senate. During his first presidency, Trump’s attempts to appoint Herman Cain and Judy Shelton to the Fed Board failed even with a Republican Senate given their unorthodox views on monetary policy. Reports suggest that former Fed governor Kevin Warsh and Kevin Hassett, a one-time chair of the Council of Economic Advisers, have been short-listed by Trump’s team.
Whether Powell’s replacement would bring about the policy easing that Trump would be looking for is debatable. Much of the Fed leadership is on lengthy terms that stretch beyond the next four years; Biden has appointed four new governors to the seven-member board, while several of the 12 regional banks also have new presidents. As such, we expect a new Fed Chair who aggressively pushes to cut rates to encounter vetoes by the other members of the rate-setting committee, unless warranted by the macroeconomic outlook.
Of course, the election outcome remains uncertain, though it does appear that the momentum is with Trump. And the analysis above inevitably relies on making assumptions around Trump’s policy agenda, which is uncertain and subject to change. However, based on what we do know, our expectation is that US growth would be stronger and inflation firmer if Trump were to win in November.
Talk to your financial professional to help make sure your portfolio is prepared for whatever happens in Washington D.C.
1 The yield curve is a line that plots interest rates of bonds having equal credit quality but differing maturity dates; its slope is used to forecast the state of the economy and interest-rate changes.
2 A basis point is a unit that is equal to 1/100th of 1% and is used to denote the change in a financial instrument. The basis point is commonly used for calculating changes in interest rates, equity indexes and the yield of a fixed-income security.
Important Risks: Investing involves risk, including the possible loss of principal. • Different investment styles may go in and out of favor, which may cause underperformance to the broader stock market.
All information provided is for informational and educational purposes only and is not intended to provide investment, tax, accounting, or legal advice. As with all matters of an investment, tax, or legal nature, you should consult with a qualified tax or legal professional regarding your specific legal or tax situation, as applicable. The preceding is not intended to be a recommendation or advice. Tax laws and regulations are complex and subject to change.
The views expressed here are those of the author. They should not be construed as investment advice. They are based on available information and are subject to change without notice. Portfolio positioning is at the discretion of the individual portfolio management teams; individual portfolio management teams, and different fund sub-advisers, may hold different views and may make different investment decisions for different clients or portfolios. This material and/or its contents are current as of the time of writing and may not be reproduced or distributed in whole or in part, for any purpose, without the express written consent of Schroders Investment Management or Hartford Funds.