• Products
  • Insights
  • Practice Management
  • Resources
  • About Us

In recent years, growth stocks have had the upper hand over value stocks—a trend bolstered by the ascendence of megacap US tech stocks. Asset owners often ask us about this period of outperformance and their own growth and value exposures, and we’ve found that some rely on old rules of thumb that don’t stand up to scrutiny.

In this article, we take on two of these “rules:”

  • First, the belief that value’s ability to outperform is dependent on the economic cycle
  • Second, the idea that value is still dominated by a handful of mature and cyclical sectors (e.g., financials and energy)

Why reconsider these rules now? As we explain below, our research suggests that three macro drivers matter most when it comes to value outperformance: inflation, real interest rates,1 and real GDP.2 Based on our outlook for these drivers, we see a positive case for value stocks over the next three to five years and believe asset owners may want to consider seeking more balance in their value and growth allocations after a long stretch of growth leadership.


For Value, It’s Not All About the Cycle

For many asset owners, the working assumption is that value outperforms in the post-recession recovery and expansion phases of the economic cycle. We find the evidence of this relationship to be inconclusive at best. We looked at the performance of US value and growth stocks in the six and 12 months following each of the nine recessions since 1960 (FIGURE 1). In the six-month post-recession periods, value outperformed growth five out of nine times. In the 12-month post-recession periods, value outperformed growth six out of nine times. All in all, it’s not a clear-cut pattern.


FIGURE 1

Post-Recession Value Outperformance Is Inconclusive
Annualized Returns for Value Relative to Growth, Six- and 12-Months Post-Recession

Chart data as of 4/30/24. Past performance does not guarantee future results. Monthly average annualized returns over the six and 12-month periods following a recession using the spread between the Russell 1000 Value Total Return Index and Russel 1000 Growth Total Return Index. See below for index definitions. For illustrative purposes only. Source: LSEG Datastream.


All of that said, we did find historical evidence of a value/growth cycle as illustrated in FIGURE 2. Looking at smoothed 10-year value/growth cycles over the same period as FIGURE 1, we identified a pattern in which five years of value outperformance (ascending line) were followed by five years of growth outperformance (descending line). The exception was the cycle in the 1970s and 1980s, when high inflation defined the economic environment. Value outperformance lasted almost 10 years in that period, after which growth took the lead.


FIGURE 2

Value/Growth Cycles Tend to Last 10 Years

Chart data: 1/31/60-4/30/24. Past performance does not guarantee future results. Russell 1000 Growth Index and Russell 1000 Value Index using the Hodrick Prescott (HP) filter. The HP filter is used in time series analysis to remove short-term fluctuations in data by separating the cyclical and longer-term components. Russell 1000 Growth Index and Russell 1000 Value Index returns are backfilled using proxy methodology prior to 1980. For the HP filter, we use a lambda of 129,600 to obtain smoother trend of value cycles. For illustrative purposes only. Source: LSEG Datastream and Wellington, 5/24.


If recessions aren’t the primary driver of value/growth cycles, what is? To answer that, we looked at a broad pool of style factors to identify those with the highest and most stable explanatory power (R-squared)3 for value/growth performance. We also interviewed a range of Wellington value and growth portfolio managers about their investment process, to help confirm our quantitative findings.

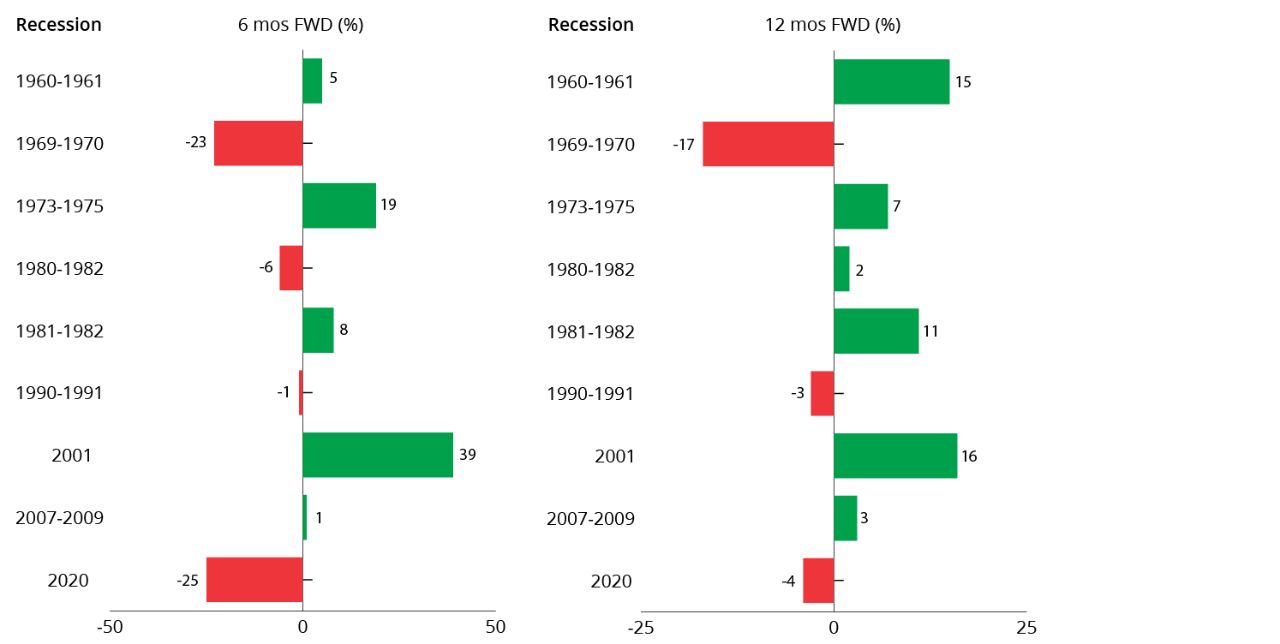
Our analysis revealed that three factors have tended to drive value outperformance: higher inflation, higher real interest rates, and higher economic growth (real GDP). Importantly, the impact of these drivers can vary greatly from one regime to another. Consider some of the stronger periods for value. During the 1970s, for example, high inflation played a significant role in value’s outperformance. The first half of the 1990s was a period of strong economic growth coming out of the US savings-and-loan crisis. The post dot-com bubble years (2000–2005) were another positive period for value, powered by elevated real rates and relatively solid growth.

Turning to the weaker periods, value barely broke into positive territory during the first half of the 1960s thanks to mediocre growth, record low inflation, and real interest rates close to zero. Value struggled from a similar mix of factors during the period following the Great Financial Crisis, from 2010–2020. Since the COVID-19 pandemic, value has been held back primarily by recession fears and artificial-intelligence (AI) enthusiasm.


Sector Diversification: Value Has Come a Long Way

Another common assumption is that value stocks are generally limited to mature, cyclical sectors, such as financials, energy, materials, and industrials—all of which are often characterized by low price-earnings (P/E) ratios,4 stable cash flows, low growth rates, and high-dividend yields. Conversely, growth stocks are typically linked to sectors that are considered innovative or disruptive and have higher P/E ratios, such as technology, healthcare, and consumer discretionary.

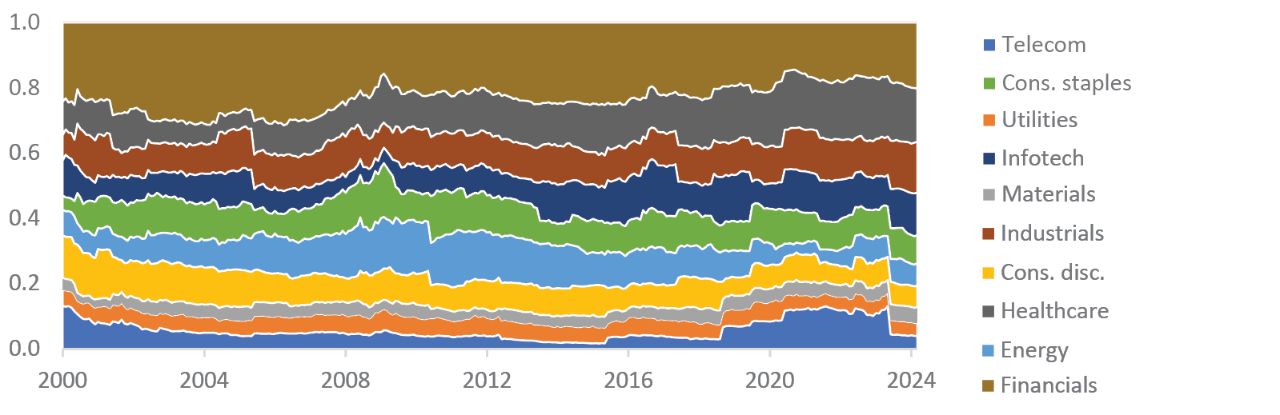
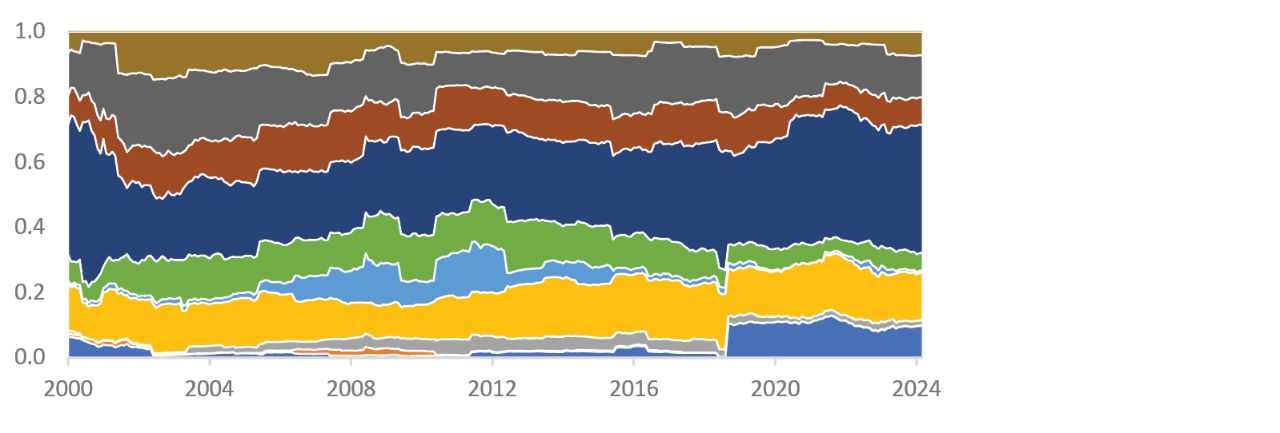
We found that over time the sector composition of the value and growth stock universes has changed markedly. As shown in the top chart in FIGURE 3, value has become less concentrated and more diversified than growth, as the latter has been reshaped by the growth of megacap stocks in the IT, communications, and consumer discretionary sectors. (It should be noted that there have been times when some of these same stocks have been designated as “value,” due to their low price-book ratios,5 and that index rules that govern value/growth designations vary.)

Currently, value’s largest weights are in healthcare (16%) and financials (20%), followed by industrials (15%), IT (13%), and consumer staples (9%). Energy is only at 7%. This is a very different mix than 10 years ago, when energy and financials made up 13% and 25% of the value index, respectively. The large weight of IT in the value index may be especially surprising to some; it's driven by industries such as hardware, semiconductors, IT services, and communications equipment, rather than software companies, which are more likely to be found in the growth index. As shown in the bottom chart in FIGURE 3, growth is highly concentrated in IT (almost 40%, up from 25% a decade ago), followed by healthcare and consumer discretionary at about 15% each.

Sector changes like those we’ve described tend to occur over long periods of time, so we expect value to continue providing more sector diversification than growth for the foreseeable future.


FIGURE 3

Shifting Sector Composition of Value and Growth
Value Sector Weights

Growth Sector Weights

Chart data: 1/31/00-3/31/24. Sector weights of the Russell 1000 Value Index and Russell 1000 Growth Index. Source: Wellington Management. 5/24.


Our Positive Outlook for Value

We see some of the key drivers of value premia that we identified earlier lining up in favor of value over the next three to five years.


Inflation

Even if central banks have managed to rein in inflation for the near term, we expect several structural factors to play a role in keeping inflation elevated relative to recent history. Tight labor markets are likely to persist, driven by shrinking working-age populations and uncertainty about immigration, among other factors. Amid rising geopolitical tensions, deglobalization and supply-chain disruptions (e.g., encouraging businesses to shift from offshoring to “friendshoring” with allies) may add to inflationary pressures. Finally, the spending required by the green-energy transition could create supply/demand imbalances across a swath of commodities, such as copper, nickel, and cobalt, driving prices higher (particularly given recent underinvestment in commodity production).


Real Rates

In an environment of higher inflation, it’s reasonable to assume that real rates will also need to be higher as a result of tighter monetary policy. Higher interest rates have a direct impact on financials (which, as shown in FIGURE 3, remain a large weight within the value index), and especially banks, which experience a boost to net-interest margins. In 2023, higher rates wrought havoc with the capital levels of some regional banks due to losses on their long-duration6 securities portfolios compared to their short-duration liabilities, and those smaller banks could be under pressure in the near term. But financials offer a wide playing field beyond banks, including insurance companies, asset managers, and payment services, where we think there may be attractive value opportunities. Higher real rates may be supported by improving economic growth as well—a combination that’s typically beneficial for value (we may already be seeing signs of this in improving equity-market breadth as discussed below).


Risks To Our View

The main risk we see to our positive outlook for value is generative AI. If the optimism about AI is matched by the reality of an enormous addressable market that could drive exponential earnings growth over coming years, regardless of the economic cycle, then growth stocks could continue to enjoy a multiyear period of outperformance.

That said, we’re seeing signs that markets are differentiating between the megacap tech stocks more and that, as recession fears have receded, the equity rally is broadening to include value-oriented sectors, small caps, and equity markets outside the US. Longer term, we also see potential headwinds for megacap tech stocks. Policymakers are being called on to create standards and regulations to ensure the safe use of these powerful new tools, potentially reducing AI’s impact on growth and productivity. In a similar vein, regulatory scrutiny could limit the growth of companies in this space, at least via acquisitions. We also think the amount of capital spending required to meet large TAM (total addressable market) estimates may exceed revenue growth expectations given that we remain in the early stages of AI adoption by industries outside of technology.


Conclusion

Our research suggests that the performance of value stocks is not necessarily aligned with the economic cycle. In different periods, inflation, real rates, and GDP can contribute to the value/growth cycle. In addition, the sector composition of the value stock universe is more diversified than in the past, with technology, healthcare, and other traditionally growth-oriented sectors now better-represented. Over the next few years, we believe structurally higher inflation and real rates could both be supportive of value. At the same time, since there are pitfalls in relying on any historic model to predict the next cycle, we think asset owners may want to consider seeking more balance in their portfolios after growth’s long rally.


To learn more about the opportunities in value investing, talk to your financial professional.


1 A real interest rate is an interest rate that has been adjusted to remove the effects of inflation. Once adjusted, it reflects the real cost of funds to a borrower and the real yield to a lender or to an investor.

2 Real GDP is an inflation-adjusted measure that reflects the value of all goods and services produced by an economy in a given year.

3 R Squared represents the percentage of the portfolio’s movement that can be explained by the market.

4 The price-to-earnings ratio measures a company’s share price relative to its earnings-per-share and helps assess the relative value of a company’s stock.

5 Price/Book is the ratio of a stock's price to its book value per share.

6 Duration is a measure of the sensitivity of an investment’s price to nominal interest-rate movement.

Russell 1000 Growth Index is an unmanaged index which measures the performance of those Russell 1000 Index companies with higher price-to-book ratios and higher forecasted growth values.

Russell 1000 Value Index is an unmanaged index measuring the performance of those Russell 1000 Index companies with lower price-to-book ratios and lower forecasted growth values. Indices are unmanaged and not available for direct investment.

Important Risks: Investing involves risk, including the possible loss of principal. • Different investment styles may go in and out of favor, which may cause underperformance to the broader stock market. • Risks of focusing investments on the healthcare related sector include regulatory and legal developments, changes in funding or subsidies, patent and intellectual property considerations, intense competitive pressures, rapid technological changes, long and costly process for obtaining product approval by government agencies, potential product obsolescence, rising cost of medical products and services, and price volatility risk. • Investments in the commodities market may increase liquidity risk, volatility and risk of loss if adverse developments occur. • Small-cap securities can have greater risks, including liquidity risk and volatility than large-cap securities. Diversification does not ensure a profit or protect against a loss in a declining market.

The views expressed here are those of the authors and Wellington Management’s Investment Strategy Team. They should not be construed as investment advice. They are based on available information and are subject to change without notice. Portfolio positioning is at the discretion of the individual portfolio management teams; individual portfolio management teams and different fund sub-advisers may hold different views and may make different investment decisions for different clients or portfolios. This material and/or its contents are current as of the time of writing and may not be reproduced or distributed in whole or in part, for any purpose, without the express written consent of Wellington Management or Hartford Funds.


About The Authors
Nanette Abuhoff Jacobson Headshot
Managing Director and Multi-Asset Strategist at Wellington Management Company LLP and Global Investment Strategist for Hartford Funds

Nanette Abuhoff Jacobson consults with clients on strategic asset allocation issues and works with investment teams throughout Wellington to develop relevant investment solutions across asset classes.

Author Headshot
Investment Strategy Analyst

The material on this site is for informational and educational purposes only. The material should not be considered tax or legal advice and is not to be relied on as a forecast. The material is also not a recommendation or advice regarding any particular security, strategy or product. Hartford Funds does not represent that any products or strategies discussed are appropriate for any particular investor so investors should seek their own professional advice before investing. Hartford Funds does not serve as a fiduciary. Content is current as of the publication date or date indicated, and may be superseded by subsequent market and economic conditions.

Investing involves risk, including the possible loss of principal. Investors should carefully consider a fund's investment objectives, risks, charges and expenses. This and other important information is contained in the mutual fund, or ETF summary prospectus and/or prospectus, which can be obtained from a financial professional and should be read carefully before investing.

Mutual funds are distributed by Hartford Funds Distributors, LLC (HFD), Member FINRA|SIPC. ETFs are distributed by ALPS Distributors, Inc. (ALPS). Advisory services may be provided by Hartford Funds Management Company, LLC (HFMC) or its wholly owned subsidiary, Lattice Strategies LLC (Lattice). Certain funds are sub-advised by Wellington Management Company LLP and/or Schroder Investment Management North America Inc (SIMNA). Schroder Investment Management North America Ltd. (SIMNA Ltd) serves as a secondary sub-adviser to certain funds. HFMC, Lattice, Wellington Management, SIMNA, and SIMNA Ltd. are all SEC registered investment advisers. Hartford Funds refers to HFD, Lattice, and HFMC, which are not affiliated with any sub-adviser or ALPS. The funds and other products referred to on this Site may be offered and sold only to persons in the United States and its territories.

© Copyright 2024 Hartford Funds Management Group, Inc. All Rights Reserved. Not FDIC Insured | No Bank Guarantee | May Lose Value