Pre-Sales Support
Mutual Funds and ETFs - 800-456-7526
Monday-Thursday: 8:00 a.m. – 6:00 p.m. ET
Friday: 8:00 a.m. – 5:00 p.m. ET
Post-Sales and Website Support
888-843-7824
Monday-Friday: 9:00 a.m. - 6:00 p.m. ET
In a world in which the value of a dollar can often seem precarious, wouldn’t it be nice to have a quick, easy-to-understand rule of thumb that calculates the time needed to double your money?
Say hello to the Rule of 72. Even for investors who aren’t particularly fond of math, it’s hard to beat the Rule of 72 for its sheer simplicity.
Here’s the formula:
Years to double your money = 72 ÷ assumed rate of return.
Consider: You’ve got $10,000 to invest and you hope to earn 8% over time. Just divide 72 by 8—which equals 9. Now you know it’ll take approximately 9 years to grow your $10,000 to $20,000.
A lower assumed rate of return adds years to the timetable while a higher rate does the opposite.
Of course, the denominator in this simple equation represents an assumption about the rate you expect to earn. Your actual rate of return will likely vary significantly (unless you have a crystal ball!) since markets are unpredictable.
That said, if you’re trying to decide whether to invest in stocks, bonds, or cash, you can use the Rule of 72 to see how long it could take to potentially double your money using historical returns (FIGURE 1 and FIGURE 2).
Along with using the Rule of 72, your financial professional can help you choose a mix of investments that potentially offer the best chance of meeting your investment goals.
FIGURE 1
Rule of 72 in Action: The Higher the Return, the Sooner Your Investment Could Double
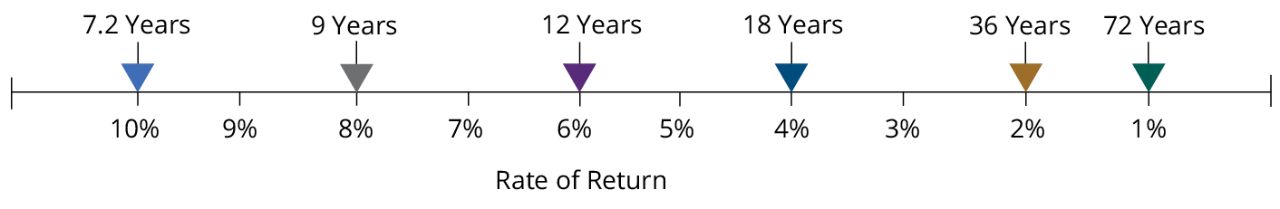
For illustrative purposes only. The chart above represents a set of possible investment-doubling time periods resulting from a series of hypothetical rates of return. Each time period was derived by dividing the corresponding rate of return by 72. Higher potential returns are associated with higher risk. Source: Hartford Funds, 4/26.
FIGURE 2
It's a Matter of Time: Some Asset Classes Have Taken Longer to Double an Investment Than Others
Stocks and Bonds vs. Certificates of Deposit
| US Equities1 | US Fixed Income1 | CDs2 |
| 8.83% | 3.77% | 4.01% |
| 8 years to double | 19 years to double | 18 years to double |
Past performance does not guarantee future results. Indices are unmanaged and not available for investment. For illustrative purposes only.
1 US equities are represented by the S&P 500 Index, a market capitalization-weighted price index composed of 500 widely held common stocks. US fixed income is represented by the Bloomberg US Aggregate Bond Index, which is composed of securities that covers the US investment grade fixed-rate bond market, with index components for government and corporate securities, mortgage pass-through securities, and asset-backed securities. Data Sources: Bloomberg and Hartford Funds, 4/26.
2 The average of Bankrate’s highest available 12-month CD rates as of 12/31/25. CDs, like all deposit accounts, have FDIC insurance up to the $250,000 legal limit.
Talk to your financial professional to help stay focused on meeting your long-term financial goals.
Important Risks: Investing involves risk, including the possible loss of principal. • Fixed income security risks include credit, liquidity, call, duration, event and interest-rate risk. As interest rates rise, bond prices generally fall. • CD Deposits up to $250,000 are insured by the FDIC; investments offer a fixed rate of interest based on agreed upon investment period; interest income is taxable annually; early withdrawals will typically result in a penalty.