1 Duration is a measure of the sensitivity of an investment’s price to nominal interest-rate movement.
2 The Personal Consumption Expenditures (PCE) price index is a measure of the prices that people living in the United States, or those buying on their behalf, pay for goods and services. The PCE price index is known for capturing inflation (or deflation) across a wide range of consumer expenses and reflecting changes in consumer behavior.
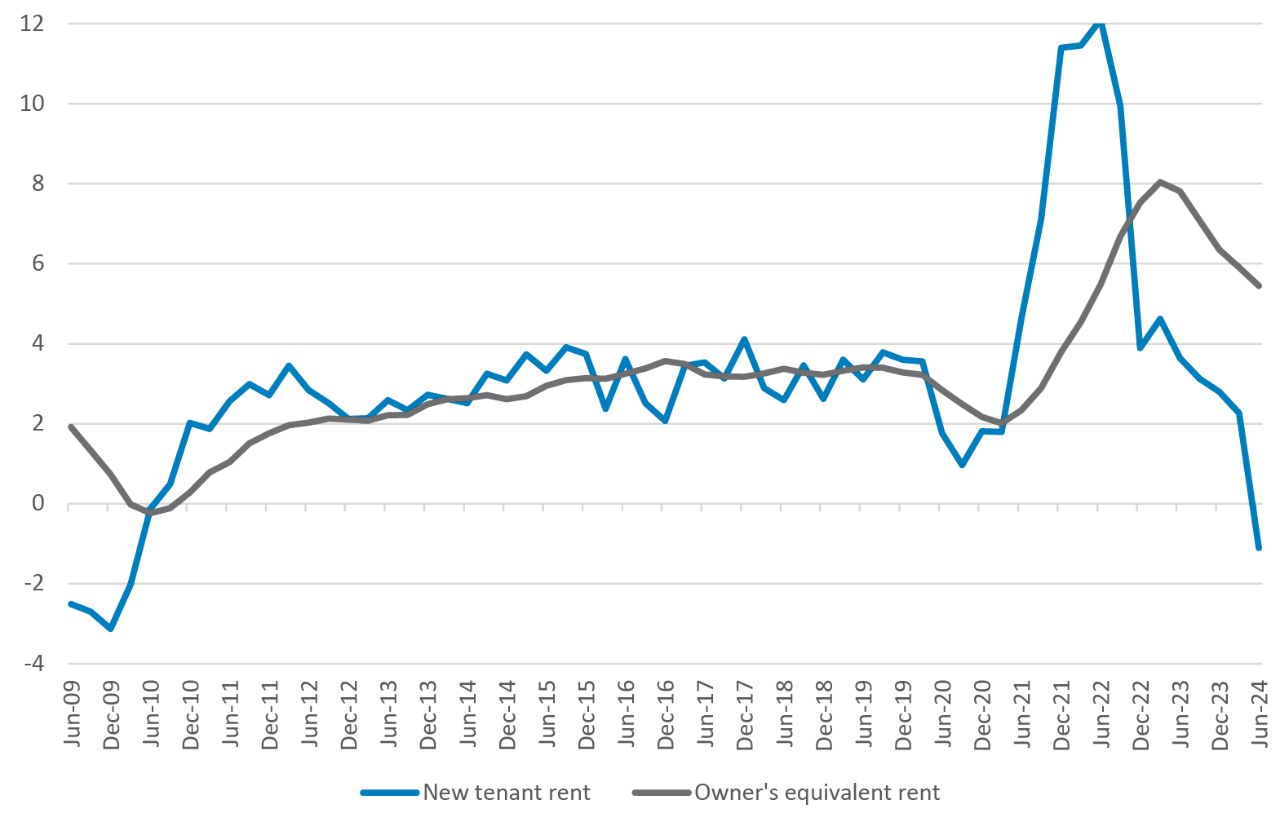
3 Owners’ equivalent rent measures how much money a property owner would have to pay in rent to be equivalent to their cost of ownership.
4 The Consumer Price Index (CPI) in the United States is defined by the Bureau of Labor Statistics as “a measure of the average change over time in the prices paid by urban consumers for a market basket of consumer goods and services.”
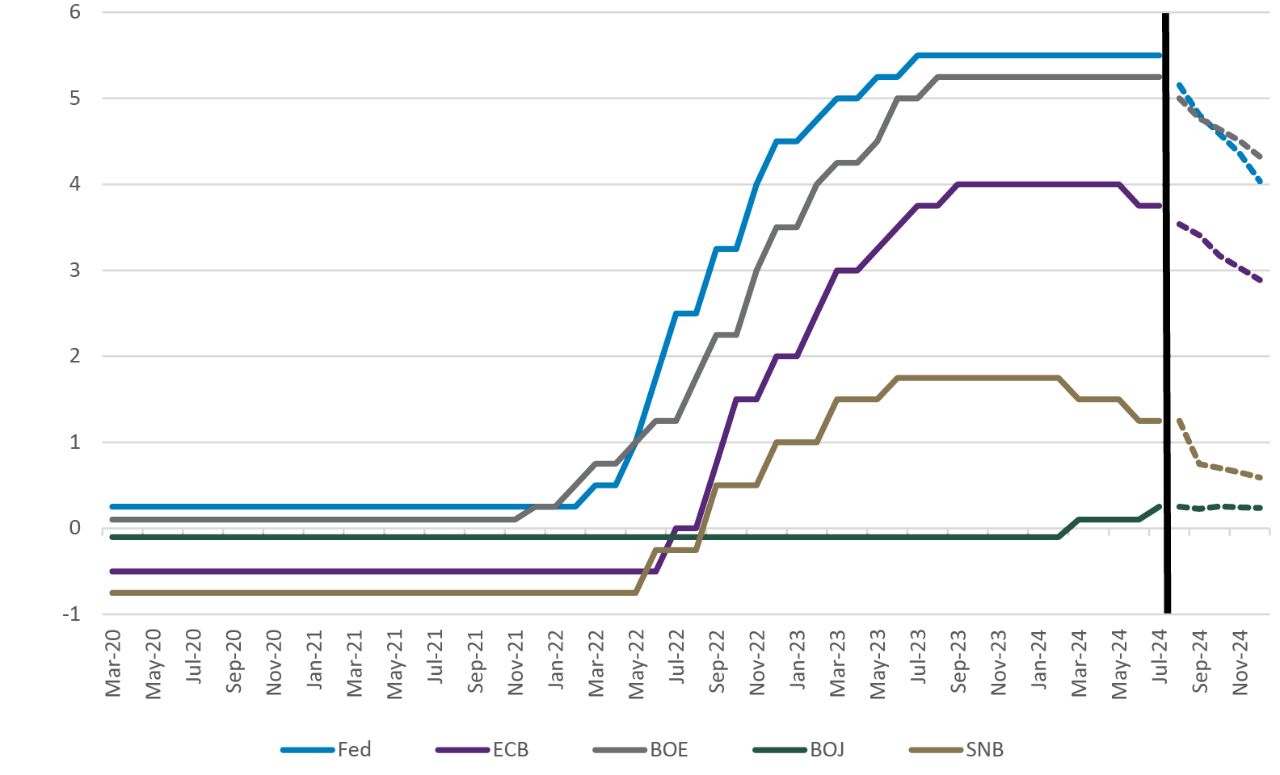
5 A basis point is a unit that is equal to 1/100th of 1% and is used to denote the change in a financial instrument. The basis point is commonly used for calculating changes in interest rates, equity indexes and the yield of a fixed-income security.
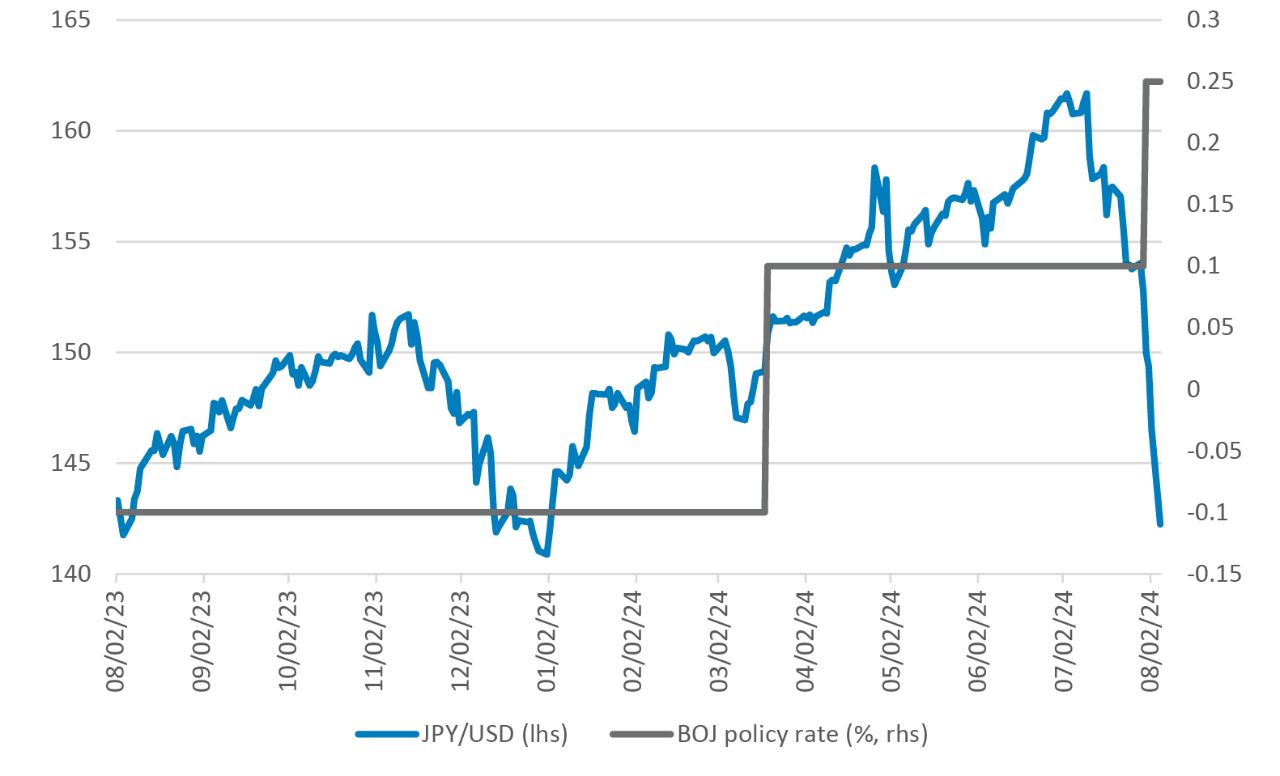
6 A “carry trade” involves borrowing funds in a currency of a country where interest rates are low and then investing them in assets and/or a currency that offers higher interest rates or perceived rates of return.
7 The job quits rate is the percentage of total employment that voluntarily leaves their jobs during a given month. It's calculated by dividing the number of quits by the number of employees who worked or were paid during the pay period that includes the 12th of the month, and then multiplying that number by 100. The quits rate is a measure of how willing or able workers are to leave their jobs.
8 Go-anywhere strategies are typically benchmark-agnostic and not bound by limits on exposure by sector, quality, currency, or country. Whereas traditional core-bond-plus strategies generally have flexibility to invest across the fixed-income landscape, they generally have upper limits on the amount that can be invested in securities rated below-investment-grade, domiciled outside the US, non-US-dollar-denominated, or reside in a particular sector (e.g., emerging markets).
9 Core/core plus strategies typically invest in a baseline of investment-grade bonds such as government, corporate, and securitized debt. Core-plus funds can take that baseline and add additional sectors such as corporate high-yield, emerging-market debt, or non-US currency exposures to enhance returns.
10 Convexity is the relationship between bond prices and bond yields.
11 Securitized credit involves pooling a large number of loans into an investable asset. Examples include mortgage-backed or asset-backed securities.
12 A Collateralized Loan Obligation (CLO) is a type of security that allows investors to purchase an interest in a diversified portfolio of company loans. There are two types of CLO tranches: debt tranches and equity tranches. Debt tranches are treated like bonds and have credit ratings and coupon payments. These debt tranches come first in terms of repayment, and there is also a pecking order within the debt tranches. Equity tranches do not have credit ratings and are paid out after all debt tranches. Equity tranches are rarely paid a cash flow but do offer ownership in the CLO itself in the event of a sale. Because equity tranche investors usually face higher risks, they often receive higher returns than debt tranche investors.
13 High-yield (HY) securities, or "junk bonds," are rated below-investment-grade because there is a greater possibility that the issuer may be unable to make interest and principal payments on those securities.
14 Carry is the difference between the yield on a longer-maturity bond and the cost of borrowing.
15 A senior bank loan is a debt financing obligation issued to a company by a bank or similar financial institution and then repackaged and sold to investors. The repackaged debt obligation consists of multiple loans. Senior bank loans hold legal claim to the borrower's assets above all other debt obligations.
16 With convertible debt, a business borrows money from a lender or investor where both parties enter the agreement with the intent (from the outset) to repay all (or part) of the loan by converting it into a certain number of its preferred or common shares at some point in the future. The agreement specifies the repayment and conversion terms which include the timeframe and the price per share for the conversion as well as the interest rate that will be paid until either conversion or maturity.
17 Emerging-market debt (EMD) are debt instruments issued by developing countries. These bonds tend to offer higher yields than Treasuries or corporate bonds in the US. Emerging-market issues tend to carry higher risks than domestic debt instruments.
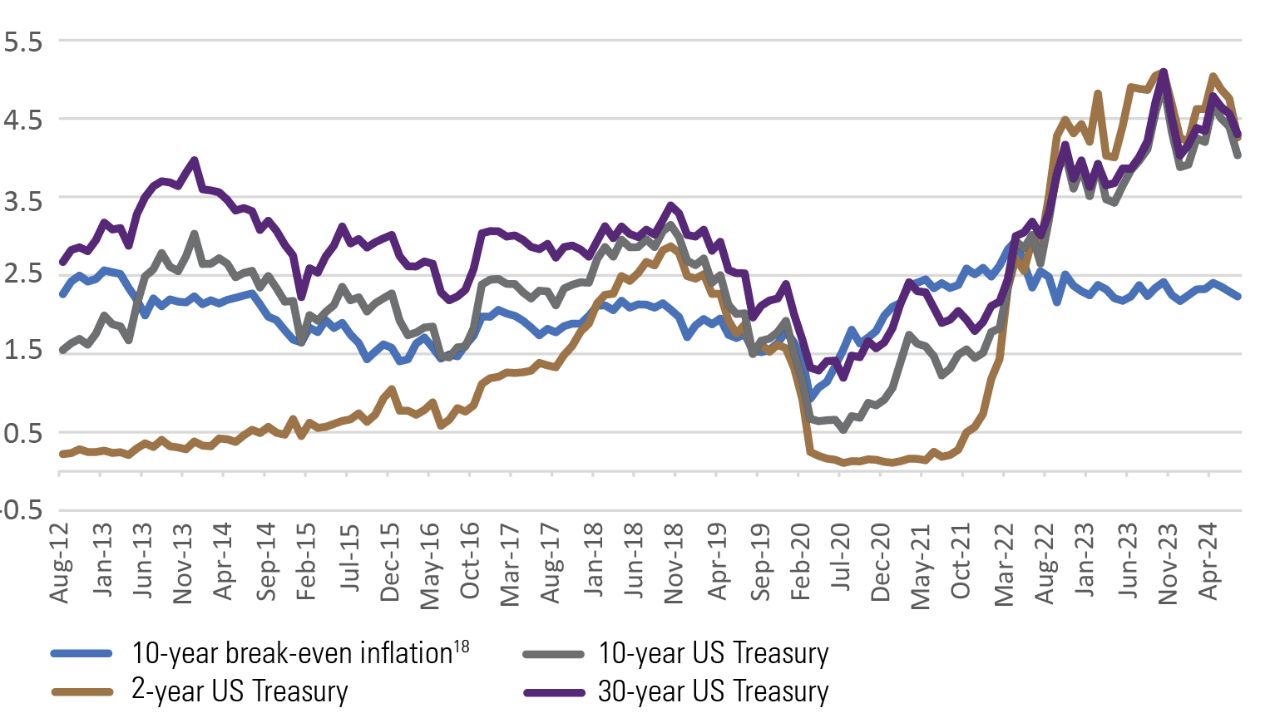
18 The break-even inflation rate is a measurement that aims to predict the effects of inflation on certain investments, by analyzing known market inflation rates from recent years. It can be calculated by comparing the yield of an inflation-based bond (such as Treasury Inflation-Protected Securities, or TIPS) with a nominal bond of the same maturity period. The difference represents the break-even inflation rate, or the rate that inflation would have to be for an investor to “break even”—or earn the same return—between purchasing TIPS or nominal Treasuries.
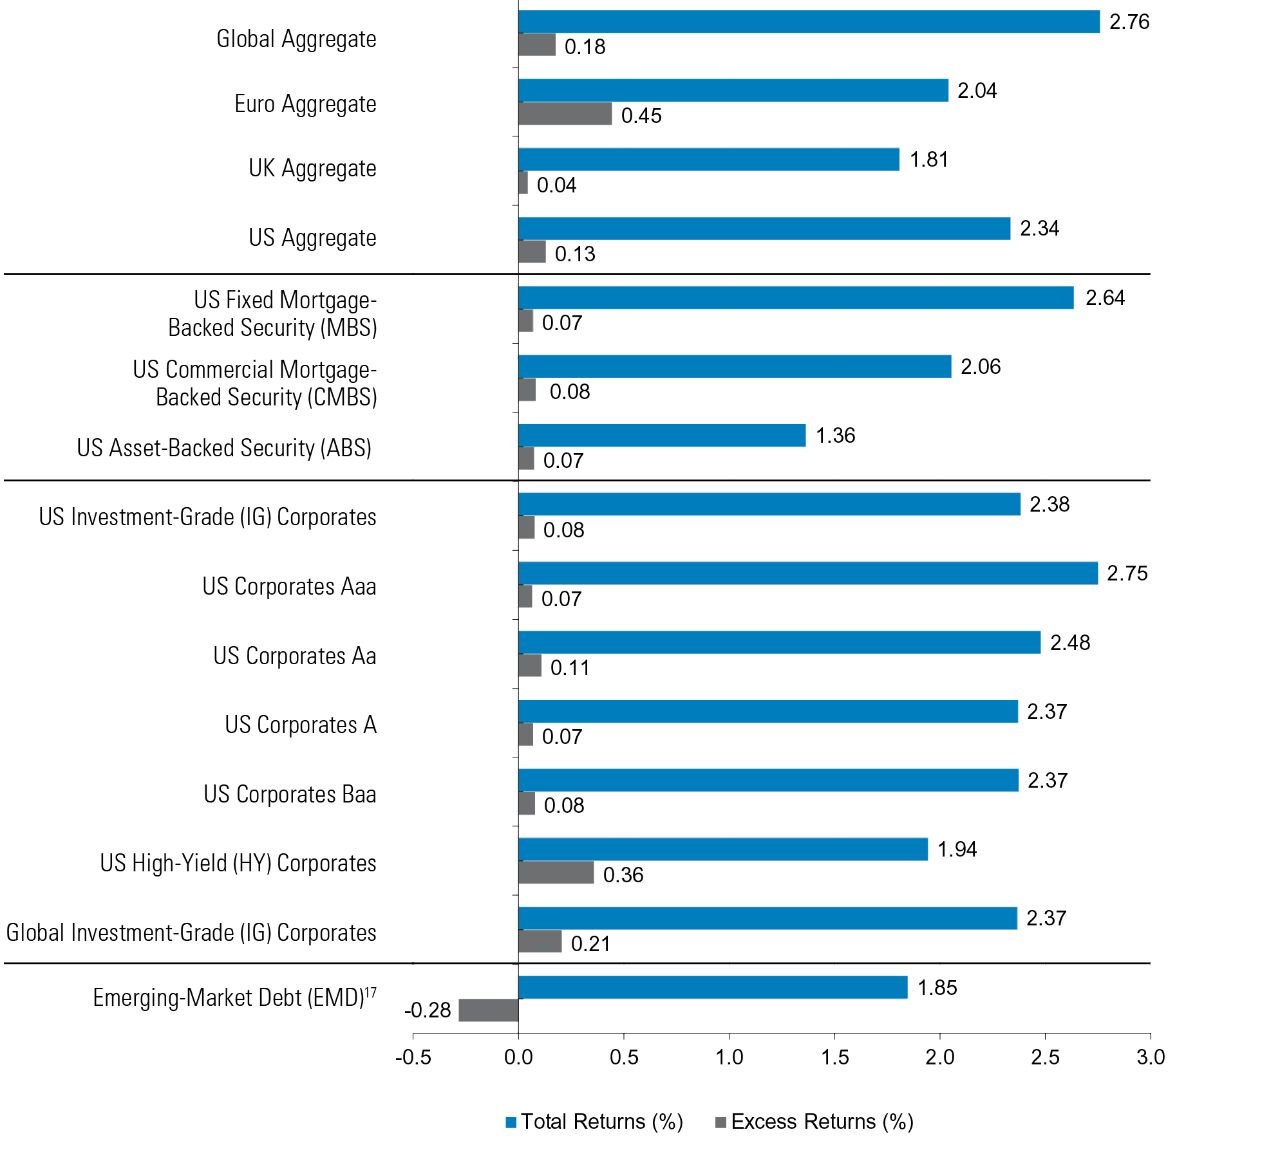
Representative Indices from Figure 6:
Global Aggregate: Bloomberg Global Aggregate Bond Index; Euro Aggregate: Bloomberg Global Aggregate Bond Index - European Euro; UK Aggregate: Bloomberg Global Aggregate Bond Index - United Kingdom; US Aggregate: Bloomberg US Aggregate Bond Index; US Fixed MBS: Bloomberg US MBS Index; US CMBS: Bloomberg CMBS ERISA Eligible Index; US ABS: Bloomberg Asset-Backed Securities Index; US IG Corporates: Bloomberg US Corporate Bond Index; US Corporates Aaa: Bloomberg Aaa Corporate Bond Index; US Corporates Aa: Bloomberg Aa Corporate Bond Index; US Corporates A: Bloomberg A Corporate Index; US Corporates Baa: Bloomberg Baa Corporate Bond Index; US High-Yield Corporates: Bloomberg US Corporate High Yield Bond Index; Global IG Corporates: Bloomberg Global Credit - Corporate Bond Index; Emerging-Markets Debt: Bloomberg Emerging Markets Hard Currency Bond Index.
Index Definitions:
Bloomberg Global Aggregate Index is a broad-based measure of the global investment-grade fixed-rate debt markets. Bloomberg Global Aggregate Bond Index - European Euro includes fixed-rate, investment-grade Euro denominated bonds. Bloomberg Global Aggregate Bond Index - United Kingdom includes fixed-rate, investment-grade sterling-denominated bonds. Bloomberg US Aggregate Bond Index is composed of securities from the Bloomberg Government/Credit Bond Index, Mortgage-Backed Securities Index, Asset-Backed Securities Index, and Commercial Mortgage-Backed Securities Index. Bloomberg US MBS Index tracks fixed-rate agency mortgage backed passthrough securities guaranteed by Ginnie Mae (GNMA), Fannie Mae (FNMA), and Freddie Mac (FHLMC). Bloomberg CMBS ERISA Eligible Bond Index measures the performance of investment-grade commercial mortgage-backed securities, which are classes of securities that represent interests in pools of commercial mortgages. The index includes only CMBS that are Employee Retirement Income Security Act of 1974. Bloomberg Asset-Backed Securities Index, the ABS component of the Bloomberg US Aggregate Index, has three subsectors: credit and charge cards, autos, and utility. Bloomberg US Corporate Bond Index covers all publicly issued, fixed rate, nonconvertible, investment-grade debt. Bloomberg Aaa Corporate Bond Index is designed to measure the performance of investment-grade corporate bonds that have a credit rating of Aaa. Bloomberg Aa Corporate Bond Index is designed to measure the performance of investment-grade corporate bonds that have a credit rating of Aa. Bloomberg A Corporate Bond Index is designed to measure the performance of investment-grade corporate bonds that have a credit rating of A. Bloomberg Baa Corporate Bond Index is designed to measure the performance of investment-grade corporate bonds that have a credit rating of Baa. Bloomberg US Corporate High Yield Bond Index is an unmanaged broad-based market-value-weighted index that tracks the total return performance of non-investment grade, fixed-rate, publicly placed, dollar denominated and nonconvertible debt registered with the Securities and Exchange Commission. Bloomberg Global Credit - Corporate Bond Index is an unmanaged index considered representative of fixed rate, non-investment grade debt of companies in the US, developed markets, and emerging markets. Bloomberg Emerging Markets Hard Currency Bond Index includes USD-denominated debt from sovereign, quasi-sovereign, and corporate EM issuers. Morningstar/LSTA Leveraged Loan Index is a market-value-weighted index that is designed to measure the performance of the US leveraged loan market based upon market weightings, spreads, and interest payments. J.P. Morgan EMBI Global Diversified Index is a broad-based, unmanaged index which tracks liquid, US Dollar emerging-market fixed- and floating-rate debt instruments issued by sovereign and quasi-sovereign entities.
Important Risks: Investing involves risk, including the possible loss of principal. • Fixed income security risks include credit, liquidity, call, duration, and interest-rate risk. As interest rates rise, bond prices generally fall. • Investments in high-yield (“junk”) bonds involve greater risk of price volatility, illiquidity, and default than higher-rated debt securities. • Mortgage-related and asset-backed securities’ risks include credit, interest-rate, prepayment, and extension risk. The value of the underlying real estate of real estate related securities may go down due to various factors, including but not limited to strength of the economy, amount of new construction, laws and regulations, costs of real estate, availability of mortgages, and changes in interest rates. • Loans can be difficult to value and less liquid than other types of debt instruments; they are also subject to nonpayment, collateral, bankruptcy, default, extension, prepayment and insolvency risks. • Foreign investments may be more volatile and less liquid than US investments and are subject to the risk of currency fluctuations and adverse political, economic and regulatory developments. These risks may be greater, and include additional risks, for investments in emerging markets.
The views expressed herein are those of Wellington Management, are for informational purposes only, and are subject to change based on prevailing market, economic, and other conditions. The views expressed may not reflect the opinions of Hartford Funds or any other sub-adviser to our funds. They should not be construed as research or investment advice nor should they be considered an offer or solicitation to buy or sell any security. This information is current at the time of writing and may not be reproduced or distributed in whole or in part, for any purpose, without the express written consent of Wellington Management or Hartford Funds.